I performed the measurements of the Audio Research I/50 with my Audio Precision SYS2722 system, concentrating on the behavior of the balanced inputs and the 4 ohm output transformer tap, as that is what I mostly used in my auditioning. The I/50's maximum voltage gain at 1kHz from the 8 ohm output transformer tap into 8 ohms was 19.6dB for the balanced input and 25.6dB for all three single-ended inputs. (The phono module, which is used with the SE1 input, was not installed.) The voltage gains from the 4 ohm tap were 3.2dB lower than from the 8 ohm tap, with both input types. Measured at the headphone jack, the maximum gain was unity for the single-ended inputs, –6dB for the balanced input. Although the balanced input is specified as preserving absolute polarity with the XLR jack's pin 2 hot, the I/50 inverted polarity with this input from the 4 ohm and 8 ohm speaker outputs and the headphone jack. The amplifier did preserve absolute polarity, ie, was noninverting, with the single-ended inputs, again at all three outputs.
The Audio Research's single-ended and balanced input impedances are specified as 48k ohms and 100k ohms, respectively. I measured 37.1k ohms at 20Hz but a low 4400 ohms at 1kHz and 4200 ohms at 20kHz for the single-ended inputs. The balanced input impedance was 52k ohms at low and middle frequencies, 44k ohms at the top of the audioband.
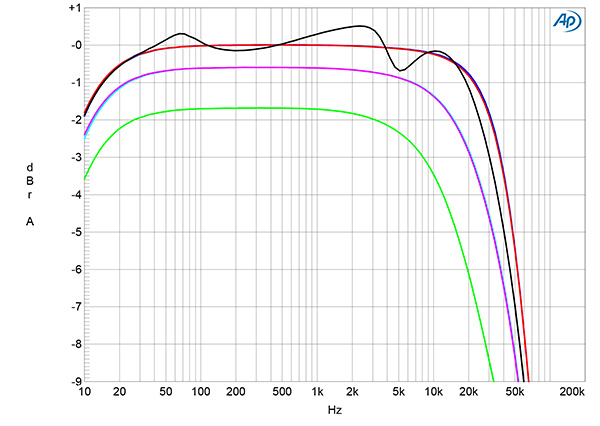
The I/50's headphone output impedance was a relatively low 48 ohms from 20Hz to 20kHz, and this output's frequency response was flat from 10Hz to 200kHz. The 4 ohm transformer tap's source impedance at low and middle frequencies was low for a tube amplifier, at 0.61 ohms, but rose to 2.3 ohms at the top of the audioband. As expected, the 8 ohm tap's source impedance was higher, at 0.97 ohms at 20Hz and 1kHz, rising to 5 ohms at 20kHz. Into our standard simulated loudspeaker, the variation in the 8 ohm tap's small-signal frequency response in the audioband, due to the Ohm's law interaction between the amplifier's source impedance and the impedance of the simulated speaker, was +0.9/–1.1dB (fig.1, gray trace). However, the increase in output impedance at the top of the audioband rolled off the output at 20kHz by 2dB into 8 ohms (blue, red traces), by 5.1dB into 4 ohms (cyan, magenta), and by 7dB into 2 ohms (green). The high-frequency rolloff was less severe from the 4 ohm tap, the output at 20kHz lying at –0.5dB into 8 ohms and –2.3dB into 4 ohms, but still –7dB into 2 ohms.
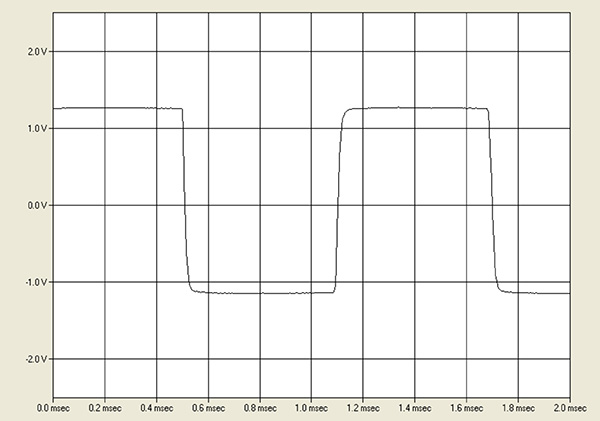
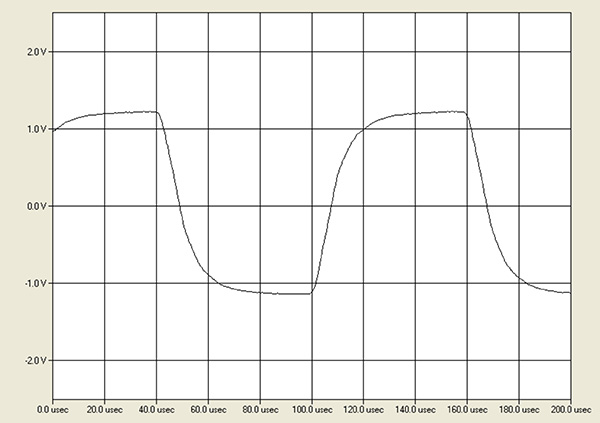
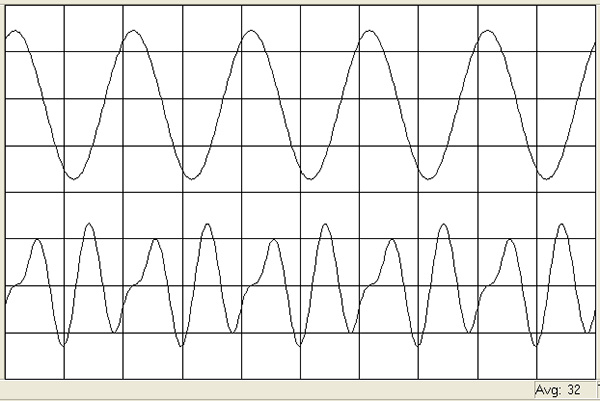
Fig.1 was taken with the balanced input and the volume control set to its maximum of "45." (The volume control operates in accurate 1dB steps.) Commendably, the excellent channel matching shown in fig.1 was preserved at lower settings of the control and with the single-ended inputs. The Audio Research amplifier's reproduction of a 1kHz squarewave from the 8 ohm tap into 8 ohms (fig.2) was superb, though the ultrasonic rolloff lengthened the risetimes with a 10kHz squarewave (fig.3). However, there is no overshoot or ringing present in this graph.
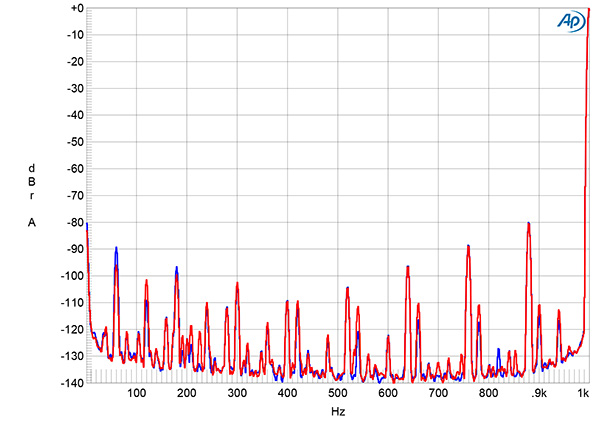
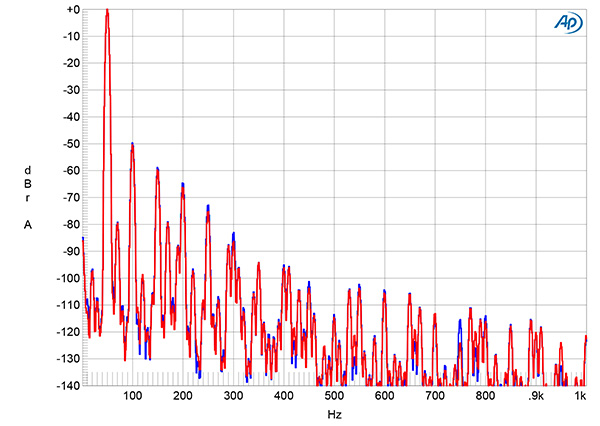
The I/50's channel separation (not shown) was very good in both directions in the midrange, at >80dB, though it decreased to 54dB at 20Hz and 60dB at 20kHz. With the volume control set to the maximum, the unweighted, wideband signal/noise ratio from the 8 ohm tap (ref. 1W into 8 ohms and measured with the single-ended input shorted to ground) was excellent, at 81.6dB (average of the two channels). This ratio improved to 84.7dB, left, and 86.8dB, right, when the measurement bandwidth was restricted to 22Hz–22kHz, and to 100dB in both channels when A-weighted. The S/N ratios from the 4 ohm tap were all 3dB greater, correlating with the 3dB lower gain from this output. Spectral analysis of the low-frequency noisefloor while the Audio Research amplifier drove a 1kHz tone at 1Wpc into 8 ohms (fig.4) revealed that AC-related spuriae were present at 60Hz and its harmonics but were all low in level. This graph was taken with the volume control set to its maximum; the AC spuriae remained at the same level at lower settings of the control, implying that they occurred in the driver and output stages after the volume control.
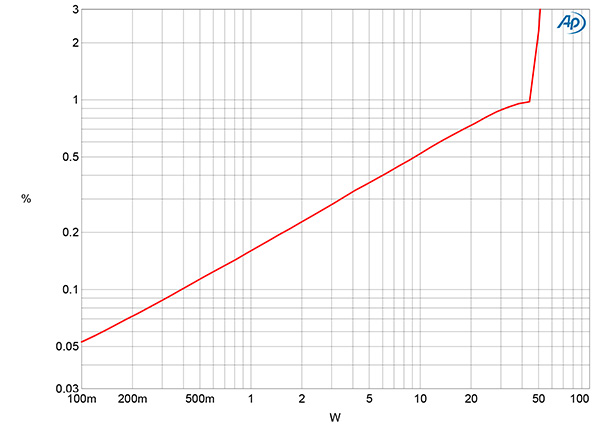
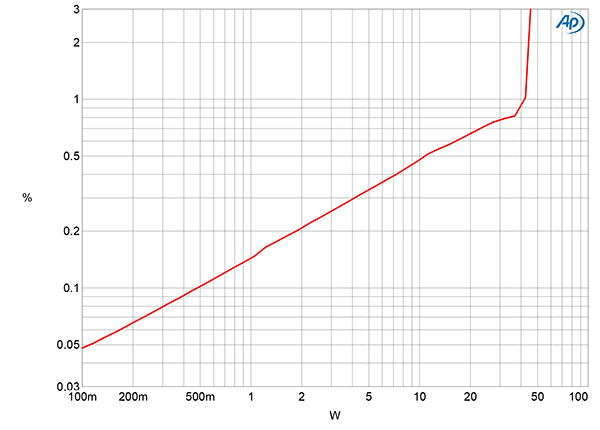
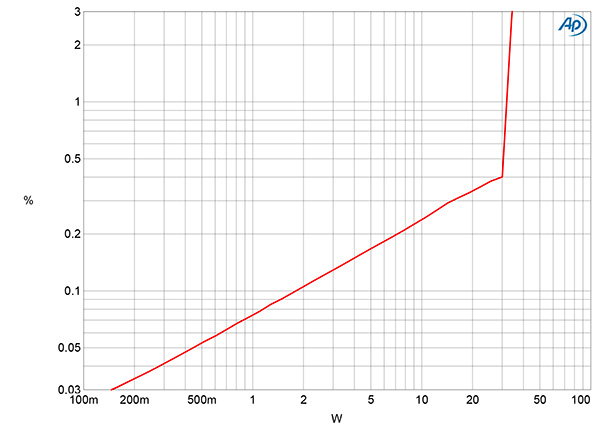
The I/50's output power is specified as 50Wpc, which is equivalent to 17dBW into 8 ohms and 14dBW into 4 ohms. With our usual definition of clipping as being when the THD+noise reaches 1%, I measured a clipping power of 44Wpc from the 8 ohm tap into 8 ohms (16.43dBW, fig.5) and 42.5Wpc from the 4 ohm tap into 4 ohms (13.26dBW, fig.6). Relaxing the definition of clipping to 3% THD+N meant that the I/50 met its specified maximum power from the 8 ohm tap but was still 0.5dB short of the specified figure from the 4 ohm tap. The THD+N percentage rises in a linear manner with increasing power in figs.5 and 6, which suggests that the circuit uses only a modest amount of loop negative feedback, but the distortion lies below 0.5% at powers below a few watts. The distortion was higher at low powers with the 8 ohm tap driving 4 ohms (not shown) but considerably lower below actual clipping with the 4 ohm tap driving 8 ohms (fig.7).
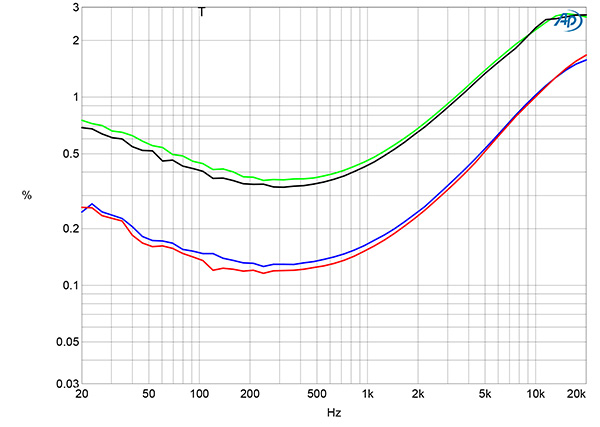
This can be seen in fig.8, which shows how the percentage of THD+noise varies with frequency into 8 ohms (blue and red traces) and 4 ohms (green, gray) at 6.33V (equivalent to 5W into 8 ohms and 10W into 4 ohms). The distortion rose at low and high frequencies into both impedances—the former is probably due to the onset of core saturation in the output transformer; the latter is most likely due to limited open-loop bandwidth, which means that less negative feedback is available in this region.
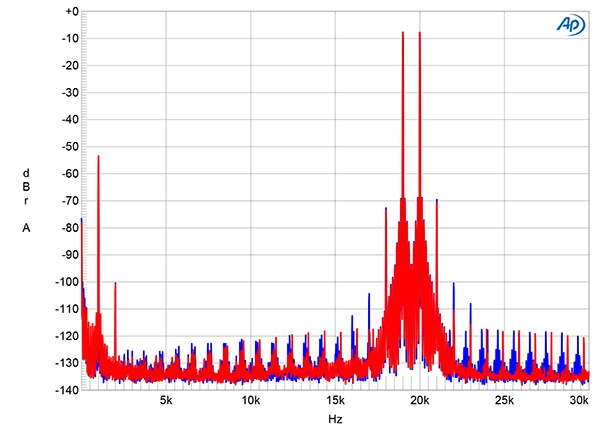
The distortion harmonic waveform (fig.9, bottom trace) primarily consists of the second harmonic, though spectral analysis (fig.10) indicates that higher-order harmonics are also present, with their levels decreasing as their order increases. With the I/50's 4 ohm tap driving an equal mix of 19 and 20kHz tones at 5Wpc peak into 8 ohms (fig.11), the 1kHz difference product lay at a fairly high –53dB (0.2%), though the higher-order products at 18 and 21kHz were almost 20dB lower in level.
The Audio Research I/50's measured performance indicates that the amplifier is happiest when it is driving a higher impedance than the nominal values of the output transformer taps. While the distortion signature is primary the subjectively benign second harmonic, the I/50 offers better linearity from its 4 ohm tap.—John Atkinson


