
Sidebar 3: Measurements
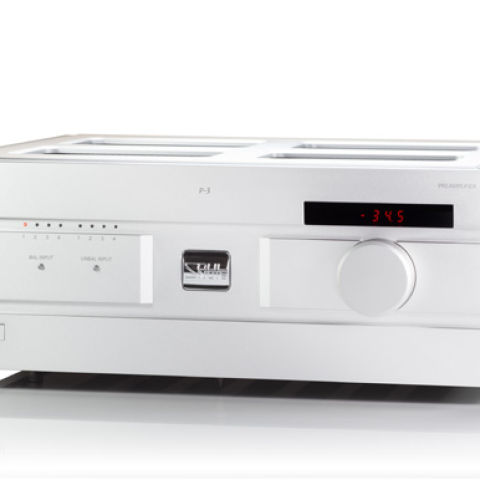
I used Audio Precision's APx555 analyzer to perform a complete set of measurements on the Soulnote P-3, serial number 22103002. The P-3 draws just 20W of power at idle and runs cool; its chassis temperature did not deviate from ambient over several hours of testing in a 70°F room. Unless otherwise noted, all measurements were taken from the balanced (XLR) outputs, with the rear-panel GND switch set to SEPARATION, which Soulnote recommends for the best sound quality.
The P-3 has four balanced and four unbalanced line inputs, three balanced outputs (which are wired in parallel), and one unbalanced output; the balanced and unbalanced outputs are selected with a front-panel button and can't be used at the same time. Absolute polarity was preserved via all inputs, ie, the P-3 is noninverting. The volume control, which uses reed relays to switch a ladder of naked-foil resistors, operates in 0.5dB steps from a display reading "–0.0" (maximum) down to "–71.5," below which the output is muted. With the volume control at its maximum, balanced gain measured at 11.27dB, close to the specified 11dB, and unbalanced gain was 6dB lower, at 5.27dB.
The P-3's input impedances were lower than I usually see. With the volume control at its maximum, the balanced input impedance was 9.1k ohms at 20Hz and 1kHz and 9k ohms at 20kHz. The unbalanced input impedance was half that, at 4.55k ohms at 20Hz and 1kHz and 4.45k ohms at 20kHz. The P-3 is best used with sources having a low output impedance; a source with a high output impedance, or with a small-value output coupling capacitor, will lose some level and possibly some low bass into the balanced load. At unity gain, the unbalanced input impedance still measured on the low side, at 5.95k ohms.
The output impedance is specified as a very low 6.8 ohms, presumably per phase. I measured 13.4 ohms at 1kHz and 13.1 ohms at 20kHz from the balanced output, which is consistent with that specification, and 7.9 ohms at 1kHz and 8 ohms at 20kHz from the unbalanced output. At 20Hz, however, the output impedance rose to 468 ohms balanced and 181 ohms unbalanced, presumably due to the presence of a coupling capacitor in series with the output. The balanced outputs all share the same buffer, such that loading multiple amplifiers from separate XLR outputs simultaneously will load the P-3 in parallel and may be subject to cross coupling between the downstream components.
Measured wideband and unweighted with the volume control set to its maximum, the residual noise at the balanced output was 33.3µV, which equates to a signal/noise ratio of 89.6dB ref. 1V output. The S/N ratio improved to 96.3dB when the measurement bandwidth was restricted to the audioband and to 98.25dB when A-weighted. The audioband figure corresponds to a residual of 15µV, close to the manufacturer's specified 13µV. The unbalanced output was noisier, at 57.2µV, giving S/N ratios of 84.5dB wideband, 91.5dB in the audioband, and 93.9dB A-weighted. Setting the GND switch to CONNECTION increased the unbalanced output's noise almost fourfold, to 219.5µV, but had no effect on the balanced output. In bypass mode, the balanced output's residual measured 35.4µV independent of the selected input, suggesting that the noise originates in the output stage rather than in the earlier circuitry. Channel separation (not shown), measured from the unbalanced outputs at 2V, was superb, at 110.5dB at 20Hz, 117dB at 1kHz, and 114.6dB at 20kHz, which is what might be expected from the P-3's dual-mono construction, with separate transformers, power supplies, and grounds for the two channels. With the GND switch set to CONNECTION, the channel crosstalk was degraded by about 6dB across the frequency range, but was still acceptable.
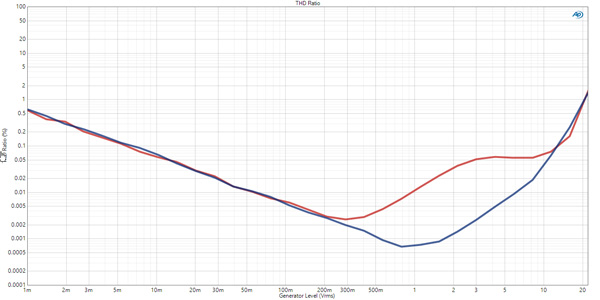
Into the very demanding 300 ohm load (red trace), the THD was higher, reaching a minimum of 0.0026% at 300mV, rising to 0.01% at 1V, then plateauing at 0.05%–0.057% between 3V and 8V before rising to 0.1% at 13V and 1% at 21.2V. The P-3 thus delivers its full 21V even into 300 ohms, indicating high current capability for a preamplifier output stage. The P-3 met its specified THD of 0.0015% at 1.5V via the balanced connection, where fig.4 shows 0.0009% at this level into 200k ohms, and the lowest wideband THD+N I measured was 0.002%.
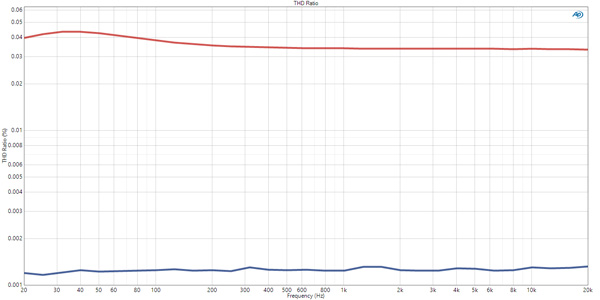
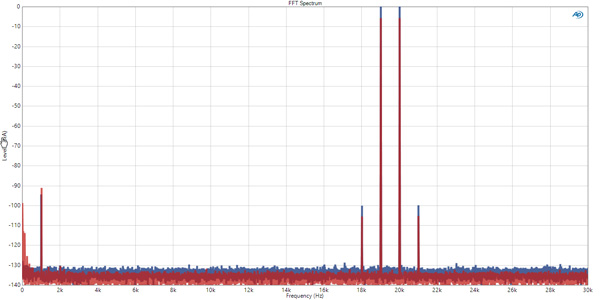
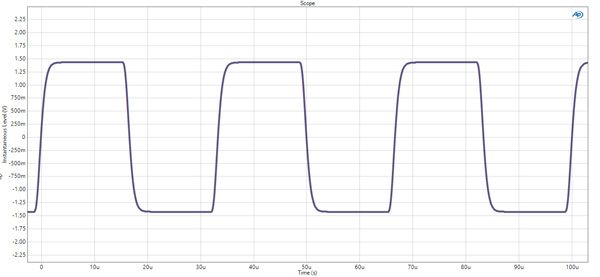
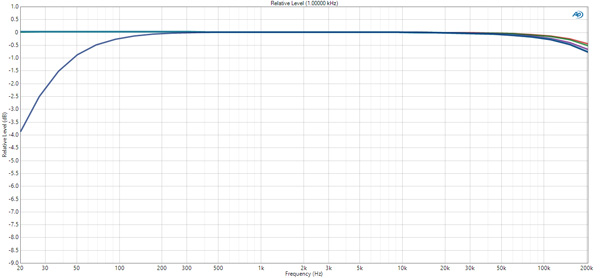
Fig.1 Soulnote P-3, frequency response at 2V into 200k ohms (balanced output) and 100k ohms (unbalanced output) with volume control set to maximum (balanced red, unbalanced purple) and to unity gain (balanced green, unbalanced teal), and into 300 ohms (blue) (0.5dB/vertical div.).
The P-3's frequency response was flat across the audioband into high impedances (200k ohms balanced, 100k ohms unbalanced), with the output down by no more than 0.05dB at 20kHz (fig.1; 0.5dB/vertical div.). From the balanced output, the response was down by just 0.1dB at 100kHz and 0.43dB at 200kHz, the limit of this graph, with the volume control at its maximum (red trace), and by 0.16dB and 0.5dB with the control set for unity gain (green trace). The unbalanced output rolled off very slightly earlier, down by 0.2dB at 100kHz and by 0.65dB (maximum volume, purple trace) and 0.71dB (unity gain, teal trace) at 200kHz. Into the punishing 300 ohm load (blue trace), the high-frequency behavior was identical, but, as expected from the rise in output impedance at 20Hz, the low-frequency response rolled off, with output down by 0.9dB at 50Hz and 3.8dB at 20Hz, the –3dB point lying at 24Hz. Such a low load impedance is very unlikely to be encountered in practice; into a typical power amplifier's input impedance of 10k ohms or more, the P-3's response will be flat well into the infrasonic region.
Fig.2 Soulnote P-3, spectrum of 1kHz sinewave, DC–1kHz, at 2V from balanced output into 200k ohms (blue) and from unbalanced output into 100k ohms with GND switch set to SEPARATION (red) and to CONNECTION (green) (linear frequency scale).
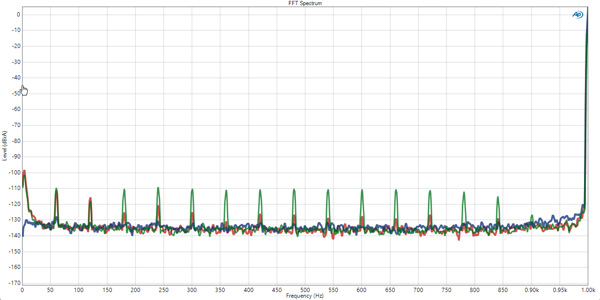
The P-3 offers very low noise. Fig.2 shows the spectrum of its output while it reproduced a 1kHz tone at 2V. The spectrum, which was taken from the balanced output (blue trace), is completely free of power-supply–related spuriae. From the unbalanced output (red trace), spuriae at 60Hz and 120Hz can be seen at –114dB and –116dB (0.0002%), with higher harmonics of the AC supply frequency at –120dB and below-all so low in level as to be inconsequential. The green trace shows the unbalanced output in an intentionally ground-looped arrangement with the GND switch set to CONNECTION, which ties the separated left- and right-channel grounds to the chassis. With the grounds connected, the entire series of supply-frequency harmonics from the third up rose to a consistent (and low) –110dB (0.0003%).
Fig.3 Soulnote P-3, spectrum of 50Hz sinewave, DC–1kHz, at 2V from balanced output into 200k ohms (blue) and from unbalanced output into 100k ohms with GND switch set to SEPARATION (red) and to CONNECTION (green) (linear frequency scale).
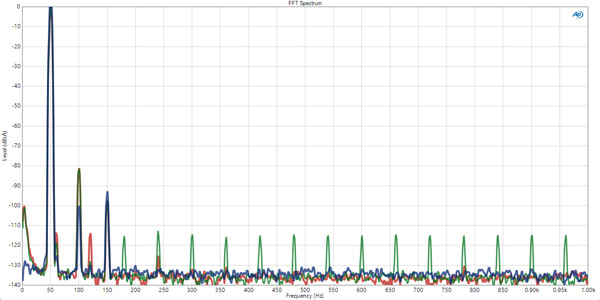
Fig.3 shows the spectra of the P-3 driven with a 50Hz tone at 2V. From the balanced output (blue trace), the second harmonic lay at –100dB (0.001%) and the third at –93dB (0.0022%), with no higher-order harmonics visible above the noisefloor, which lay at –133dB. This predominantly third-harmonic signature is what one would expect from a balanced, symmetrical circuit like the P-3's Type-R output stage, in which the even-order harmonics generated by the two halves of the circuit cancel. From the unbalanced output (red trace; green trace with the GND switch set to CONNECTION), the third harmonic lay slightly lower, at –103dB (0.0007%), but the second harmonic was much higher, at –81dB (0.009%); the unbalanced output is taken from one phase of the balanced circuit and doesn't benefit from cancellation. Even so, 0.009% of the second harmonic is very low in absolute terms, and this harmonic is the most subjectively benign. The AC-related spuriae seen in fig.2 are also visible in this graph.
Fig.4 Soulnote P-3, balanced output, THD (%) vs 1kHz output voltage with volume control set for unity gain into: 200k ohms (blue), 300 ohms (red).
I examined how the P-3's distortion changed with level using the balanced output with the volume control set at unity gain, so the horizontal axis of fig.4 shows both the input and the output voltage. Below 200mV, the measured THD+N was dominated by noise, which doesn't vary with level, so it decreases as the level rises. Into 200k ohms (blue trace), the THD+N reached a minimum of a superbly low 0.0007% at 800mV then rose gently with increasing level, reaching 0.01% at 6V and 0.1% at 12.8V. Stereophile defines a preamplifier's clipping point as when the THD+N reaches 1%; this occurred at 20.8V into 200k ohms. In a separate test, with the volume control at its maximum, the balanced output reached 0.89% THD at 21.27V and 1.15% at 21.58V, with an input of just over 6V, so the manufacturer's specified maximum output of 21V RMS is accurate.
Fig.5 Soulnote P-3, balanced output, THD (%) vs frequency at 2V into: 200k ohms (blue), 300 ohms (red).
To examine how the distortion changed with frequency at a level where the reading was not dominated by noise, I measured the THD at 2V into 200k ohms and 300 ohms (fig.5). Into the high impedance (blue trace), the THD was superbly low and almost constant with frequency, at 0.0012%–0.0013% from 20Hz to 20kHz. Into 300 ohms (red trace), it was almost 30 times higher, at 0.034% in the midrange and treble, rising slightly to a maximum of 0.043% between 30Hz and 40Hz.
Fig.6 Soulnote P-3, HF intermodulation spectrum, DC–30kHz, 19+20kHz at 1:1 at 2V, balanced output into 200k ohms (blue), unbalanced output into 100k ohms (red) (linear frequency scale).
Tested for intermodulation distortion with an equal mix of 19 and 20kHz tones at unity gain and 2V RMS, the P-3 performed well from both outputs (fig.6). The second-order difference product at 1kHz lay at –95dB (0.002%) from the balanced output (blue trace) and at –91dB (0.003%) from the unbalanced output (red trace), the latter again reflecting the absence of even-order cancellation at the unbalanced output, while the higher-order products at 18kHz and 21kHz lay at –100dB (0.001%) balanced and –105dB (0.0005%) unbalanced.
Fig.7 Soulnote P-3, 30kHz squarewave at 2V into 200k ohms.
Soulnote specifies the P-3's frequency response as extending to 1MHz, ±3dB. I was unable to verify this, as 200kHz is the upper limit of the APx555's signal generator as currently configured. However, the P-3's reproduction of a 30kHz squarewave (fig.7) had short risetimes, of 1.8µs, with no overshoot or ringing and with the two traces overlaying exactly. There is no reason to believe that specification is out of reach.
Overall, the Soulnote P-3 offers excellent measured performance: an extremely wide bandwidth, superbly low distortion into normal loads, very low noise, and superb channel separation. Prospective buyers should take note of the relatively low input impedances, however, when selecting the ideal source pairing.—James Grinalds