Sidebar 3: Measurements
I measured the Sony DMP-Z1 with my Audio Precision SYS-2722 system (see the January 2008 "As We See It") using test-tone files copied to the Sony's internal storage. The DMP-Z1's battery was fully charged before I began testing, and I measured the player's performance at its single-ended headphone jack in Direct Source mode, which bypasses the DSP functions.
Apple's USB Prober utility identified the DMP-Z1 as "PLAYER" from "Sony" with serial number "1045A0A1000727" and confirmed that its USB port operated in the optimal isochronous asynchronous mode. Apple's AudioMIDI utility revealed that, via USB, the DMP-Z1 accepted 16-, 24-, and 32-bit integer data sampled at all rates up to 384kHz. The Sony's maximum output level at 1kHz was 2.02V in normal mode, 4.0V in High Gain mode. The output impedance was a low 5.5 ohms from 20Hz to 20kHz. The output preserved absolute polarity (ie, was noninverting).
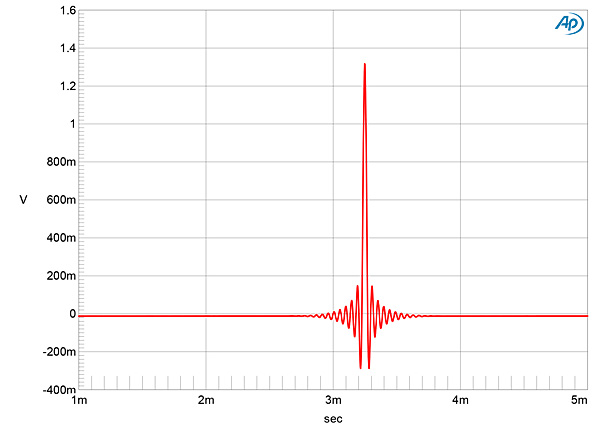
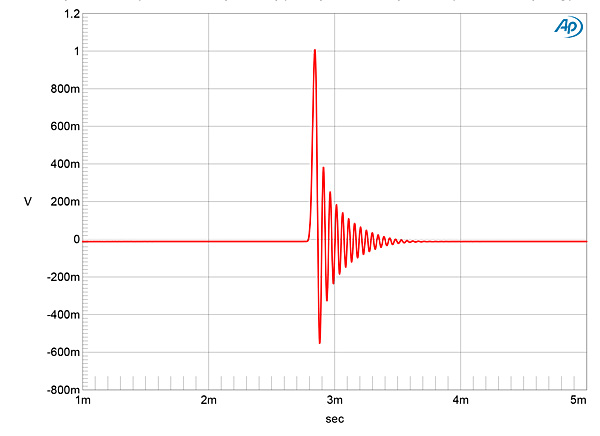
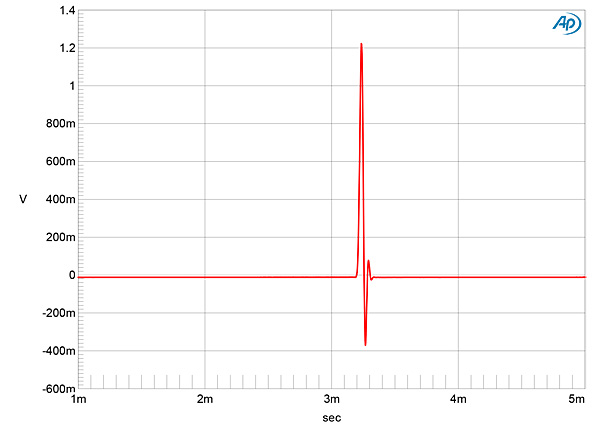
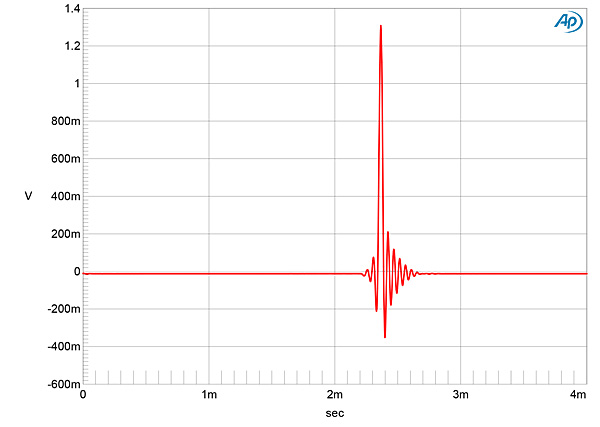
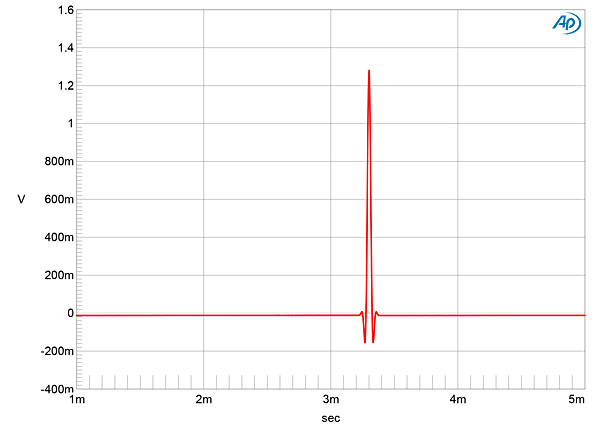
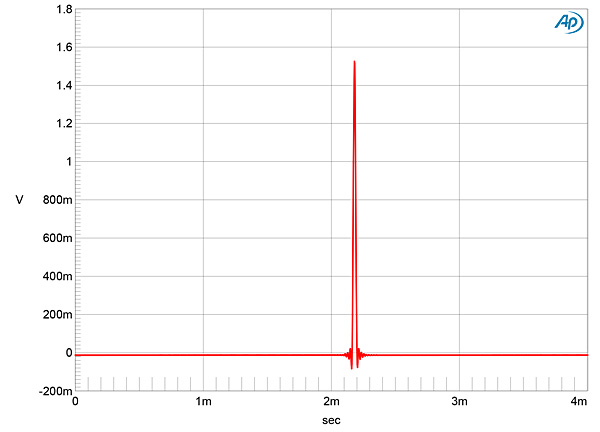
I examined the DMP-Z1's behavior in both the time and frequency domains with each of its six reconstruction filters. The Sharp filter's impulse response was a conventional time-symmetrical linear-phase type (fig.1), while the Short Delay Sharp filter's impulse response (fig.2) was minimum-phase, with all the ringing following the single high sample. The Short Delay Slow filter's impulse response (fig.3) was also minimum-phase, but, as its name implies, very short. The impulse response of the Low Dispersion Short Delay filter was a hybrid type identical to that of the Pro-Ject Pre Box S2 Digital's Hybrid filter2 (fig.4), while that of the Slow filter was an extremely short linear-phase type (fig.5). The Super Slow filter had a time-perfect impulse response with no pre- or post-ringing (fig.6).
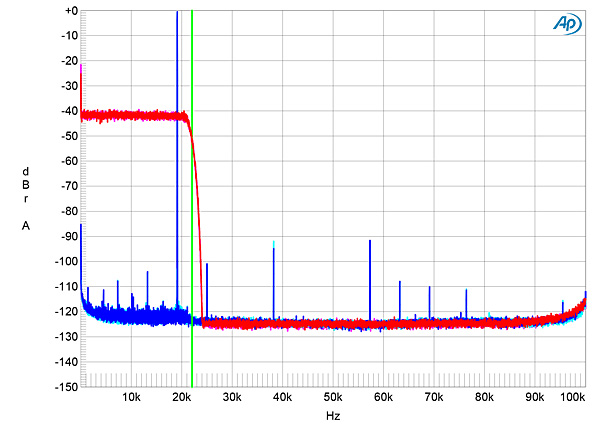
 With white noise sampled at 44.1kHz, the Sony's output with the Sharp and Short Delay Sharp reconstruction filters rolled off above 20kHz (fig.7) magenta and red traces), reaching full stop-band attenuation at 24kHz. The aliased image of a 19.1kHz tone at 0dBFS (cyan, blue) was suppressed by 101dB, and the second and third harmonics of this tone lay below –90dB (0.003%). With the Low Dispersion Short filter, the ultrasonic output rolled off slightly less quickly (fig.8), with the aliased tone suppressed by 44dB.
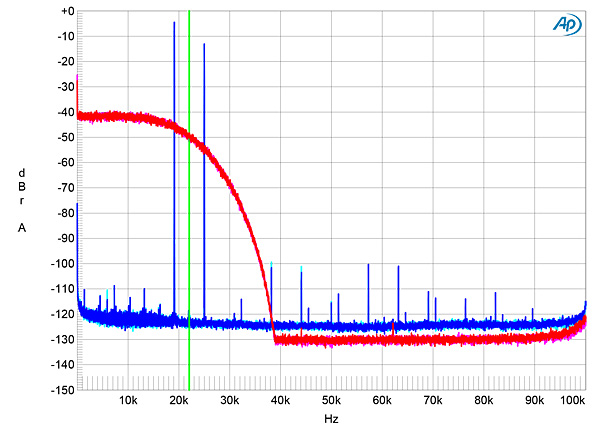
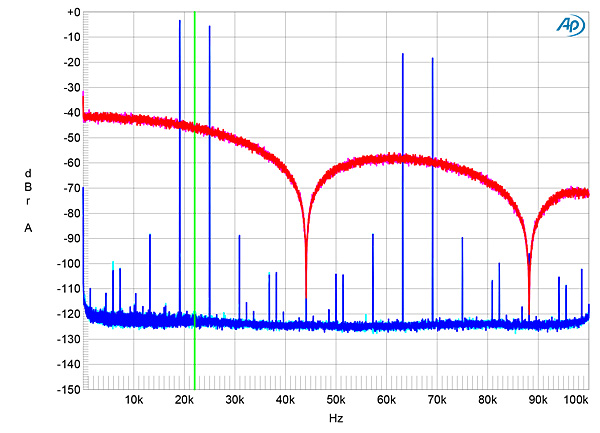
 The Slow and Short Delay Slow filters behaved identically in the frequency domain, with a rolloff that starts in the top audio octave, lies at –3dB at 18kHz, but doesn't reach full attenuation until 38kHz (fig.9, magenta and red traces). The aliased tone at 25kHz is suppressed by just 12dB with this filter. The Super Slow filter rolls off very slowly, with the response down by 1dB at 15kHz, and nulls at 44.1 and 88.2kHz (fig.10, red and magenta traces).
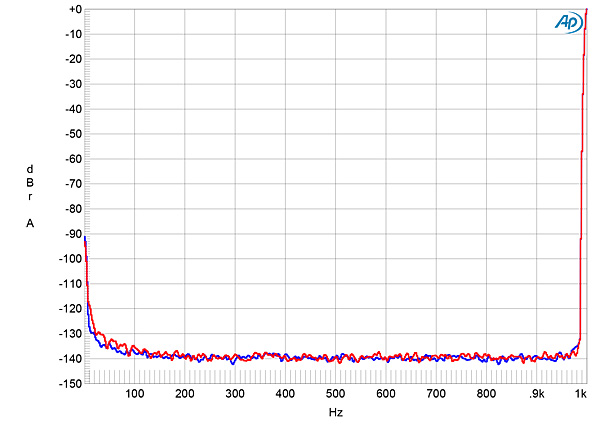
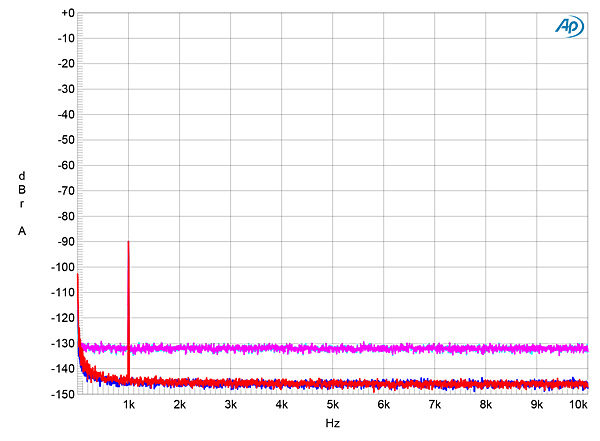
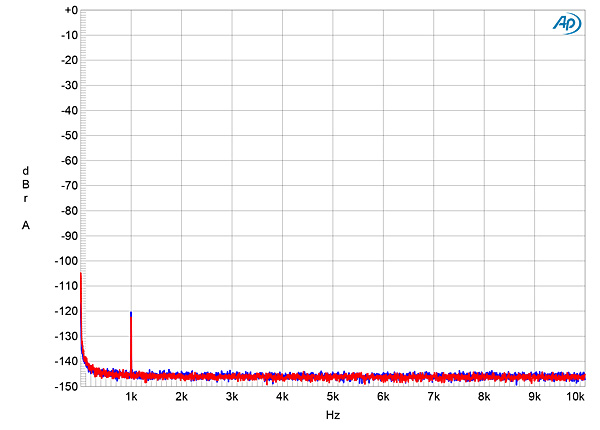
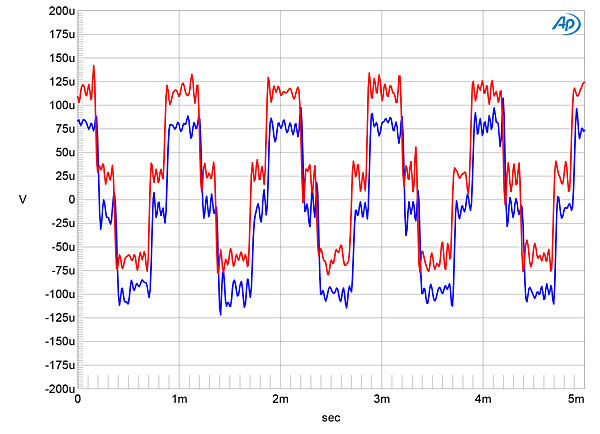
 Channel separation was superb, at >92dB in both directions from 20Hz to 20kHz. As expected with a battery-powered device, the DMP-Z1's low-frequency noise floor was both very clean and very low in level (fig.11). Increasing the bit depth from 16 to 24 with a dithered 1kHz tone at –90dBFS lowered the noise floor by around 16dB (fig.12), implying resolution of close to 19 bits. Repeating this analysis with a dithered 1kHz tone at –120dBFS gave a superbly clean spectrum, with no harmonics visible above the low noise floor (fig.13). With undithered data representing a tone at exactly –90.31dBFS (fig.14), the three DC voltage levels described by the data were well resolved, with a symmetrical waveform. A very slight (25µV) DC offset can be seen in the right channel (red trace).
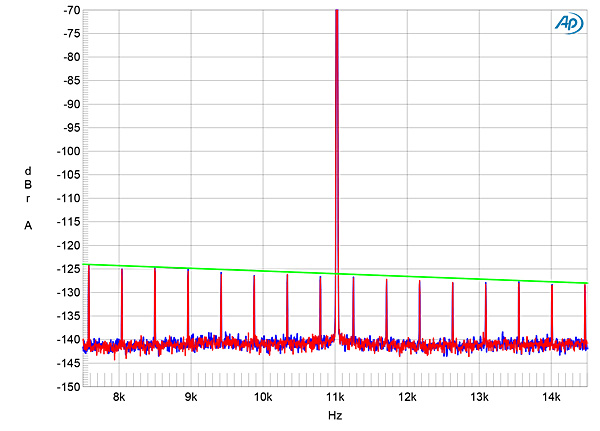
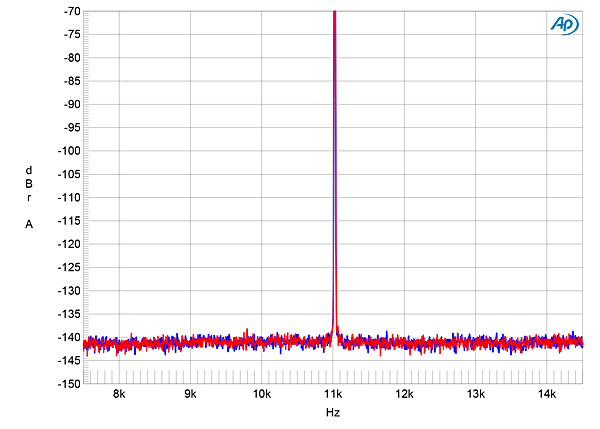
 When I tested the Sony DMP-Z1 for its rejection of word-clock jitter using undithered, 16-bit J-Test data sourced from both its USB input and its internal storage, the odd-order harmonics of the low-frequency, LSB-level squarewave were all at the correct levels (fig.20, sloping green line). Unlike some other D/A processors I've recently tested, the spectral spike that represents the high-level tone at one-fourth the sample rate was very narrow at its base, suggesting very low random low-frequency jitter. This excellent jitter rejection was repeated with 24-bit data (fig.21).
 Sony's DMP-Z1 turns in superb measured performance, indicative of equally superb analog and digital audio engineering.—John Atkinson
Footnote 1: See fig.6 here.
Fig.1 Sony DMZ-1, Short Delay Sharp filter, impulse response (one sample at 0dBFS, 44.1kHz sampling, 4ms time window).
Fig.2 Sony DMZ-1, Short Delay Sharp filter, impulse response (one sample at 0dBFS, 44.1kHz sampling, 4ms time window).
Fig.3 Sony DMZ-1, Short Delay Slow filter, impulse response (one sample at 0dBFS, 44.1kHz sampling, 4ms time window).
Fig.4 Sony DMZ-1, Low Dispersion Short Delay filter, impulse response (one sample at 0dBFS, 44.1kHz sampling, 4ms time window).
Fig.5 Sony DMZ-1, Slow filter, impulse response (one sample at 0dBFS, 44.1kHz sampling, 4ms time window).
Fig.6 Sony DMZ-1, Super Slow filter, impulse response (one sample at 0dBFS, 44.1kHz sampling, 4ms time window).
Fig.7 Sony DMZ-1, Sharp filter, wideband spectrum of white noise at -4dBFS (left channel red, right magenta) and 19.1kHz tone at 0dBFS (left blue, right cyan), with data sampled at 44.1kHz (20dB/vertical div.).
Fig.8 Sony DMZ-1, Low Dispersion Short filter, wideband spectrum of white noise at -4dBFS (left channel red, right magenta) and 19.1kHz tone at 0dBFS (left blue, right cyan), with data sampled at 44.1kHz (20dB/vertical div.).
Fig.9 Sony DMZ-1, Slow filter, wideband spectrum of white noise at -4dBFS (left channel red, right magenta) and 19.1kHz tone at 0dBFS (left blue, right cyan), with data sampled at 44.1kHz (20dB/vertical div.).
Fig.10 Sony DMZ-1, Super Slow filter, wideband spectrum of white noise at -4dBFS (left channel red, right magenta) and 19.1kHz tone at 0dBFS (left blue, right cyan), with data sampled at 44.1kHz (20dB/vertical div.).
Fig.11 Sony DMZ-1, spectrum of 1kHz tone at 0dBFS with 24-bit data (left blue, right red) (20dB/vertical div.).
Fig.12 Sony DMZ-1, spectrum with noise and spuriae of dithered 1kHz tone at -90dBFS with: 16-bit data (left channel cyan, right magenta), 24-bit data (left blue, right red) (20dB/vertical div.).
Fig.13 Sony DMZ-1, spectrum with noise and spuriae of dithered 1kHz tone at -120dBFS with 24-bit data (left blue, right red) (20dB/vertical div.).
Fig.14 Sony DMZ-1, waveform of undithered 1kHz sinewave at -90.31dBFS, 16-bit data (left channel blue, right red).
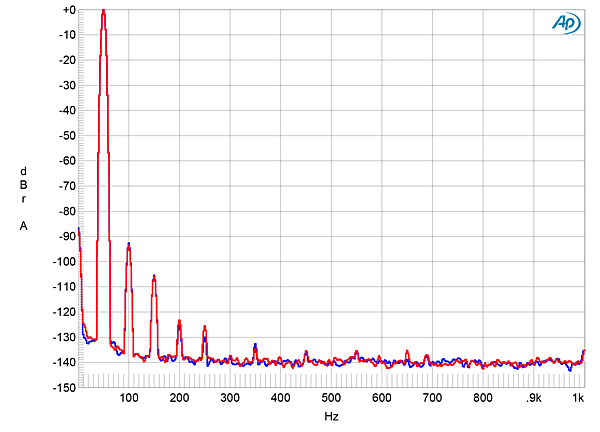
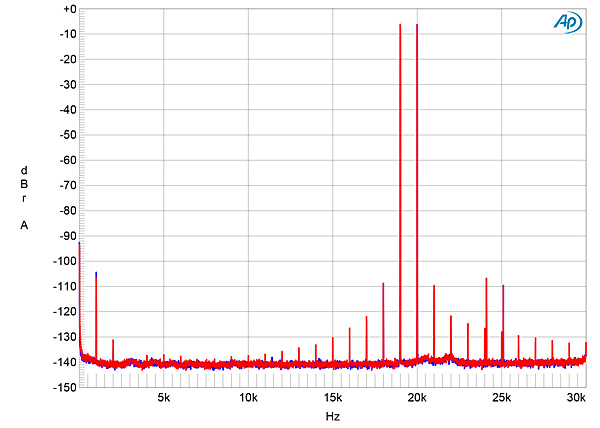
Harmonic distortion was very low, with the second harmonic the highest in level, at just below –90dB (0.003%, fig.15), accompanied by the third harmonic at –106dB (0.0005%). With a full-scale mix of tones at 19 and 20kHz and the Sharp and Short Delay Sharp filters, the noise floor was clean and the second-order difference product
Fig.15 Sony DMZ-1, spectrum of 50Hz sinewave, DC-1kHz, at 0dBFS into 600 ohms (left channel blue, right red; linear frequency scale).
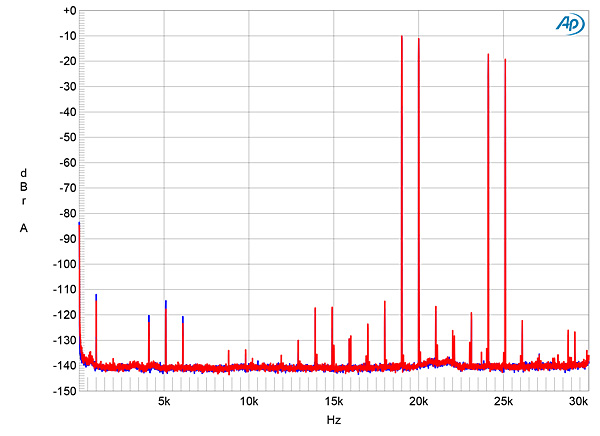
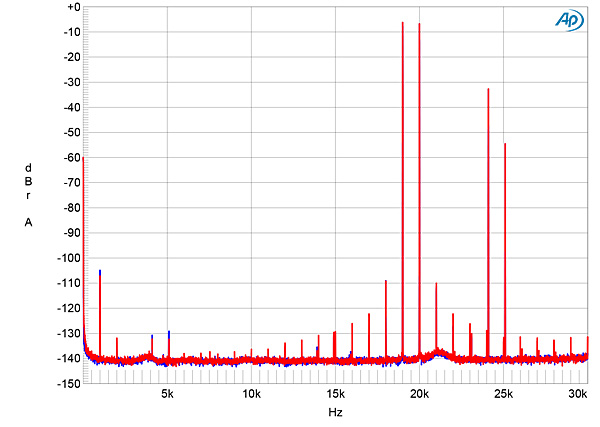
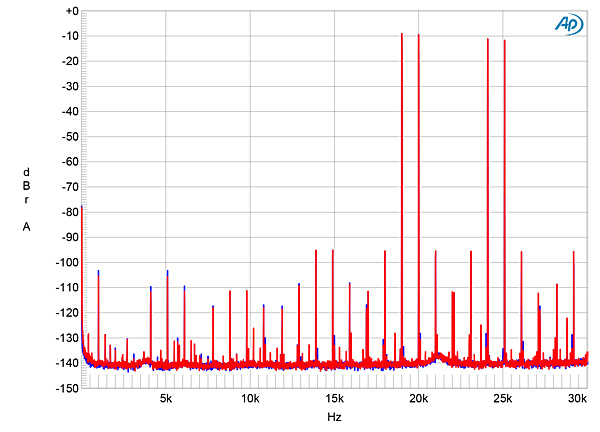
at 1kHz lay at an extremely low –106dB (fig.16). With the relatively slow ultrasonic rolloffs of the Slow and Short Delay Slow filters, the aliased images of the fundamental tones can be seen at high levels (fig.17) but were much lower in level with the Low Dispersion Short Delay filter (fig.18). They are hardly suppressed at all with the Super Slow filter (fig.19), and several other aliasing products make appearances in the audioband.
Fig.16 Sony DMZ-1, Sharp filter, HF intermodulation spectrum, DC-30kHz, 19+20kHz at 0dBFS into 600 ohms, 44.1kHz data (left channel blue, right red; linear frequency scale).
Fig.17 Sony DMZ-1, Slow filter, HF intermodulation spectrum, DC-30kHz, 19+20kHz at 0dBFS into 600 ohms, 44.1kHz data (left channel blue, right red; linear frequency scale).
Fig.18 Sony DMZ-1, Low Dispersion Short Delay filter, HF intermodulation spectrum, DC-30kHz, 19+20kHz at 0dBFS into 600 ohms, 44.1kHz data (left channel blue, right red; linear frequency scale).
Fig.19 Sony DMZ-1, Super Slow filter, HF intermodulation spectrum, DC-30kHz, 19+20kHz at 0dBFS into 600 ohms, 44.1kHz data (left channel blue, right red; linear frequency scale).
Fig.20 Sony DMZ-1, Sharp filter, high-resolution jitter spectrum of analog output signal, 11.025kHz at -6dBFS, sampled at 44.1kHz with LSB toggled at 229Hz: 16-bit data (left channel blue, right red). Center frequency of trace, 11.025kHz; frequency range, Ò3.5kHz.
Fig.21 Sony DMZ-1, Sharp filter, high-resolution jitter spectrum of analog output signal, 11.025kHz at -6dBFS, sampled at 44.1kHz with LSB toggled at 229Hz: 24-bit data (left channel blue, right red). Center frequency of trace, 11.025kHz; frequency range, Ò3.5kHz.
Footnote 1: See fig.6 here.