I measured the Questyle Audio QP1R with my Audio Precision SYS2722 system (see the January 2008 As We See It."). Source materials were WAV and AIFF test-tone files, as well as DSD64 and DSD128 files of test tones prepared for me by Malcolm Hawksford. The QP1R's battery was fully charged at the start of the testing, and the player's firmware at the time of testing was the original combination of HW v.3.0 and SW v.0.07 Beta. The Line output was set to Fixed, and I looked at the QP1R's performance via both its Line and Headphone outputs.
The volume control operated in accurate 0.5dB steps, with the maximum volume indicated as "60." The maximum output level at 1kHz from the Line output was 1.68V with both PCM and DSD data, and the analog output was in the correct, non-inverted polarity, sourced from a constant 44 ohms across the audioband. By contrast, the Headphone output inverted signal polarity and featured a much lower source impedance: approximately 1 ohm including the cables, which will be appropriate for use with low-impedance headphones. With the Gain set to High, the maximum level at 1kHz from the Headphone output was 1.99V, decreasing to 996mV with it set to Low. (With the latest firmware, the Low gain setting becomes Middle and the new Low gain setting has a maximum output level of 530mV.)
Even into a benign load of 100k ohms, the maximum level was lower from both outputs at low frequencies than it was at 1kHz. With a full-scale 20Hz tone and the volume control set to its maximum, the player emitted a mechanical clicking sound. Reducing the volume to "55" (ie, –2.5dB) eliminated the noise.
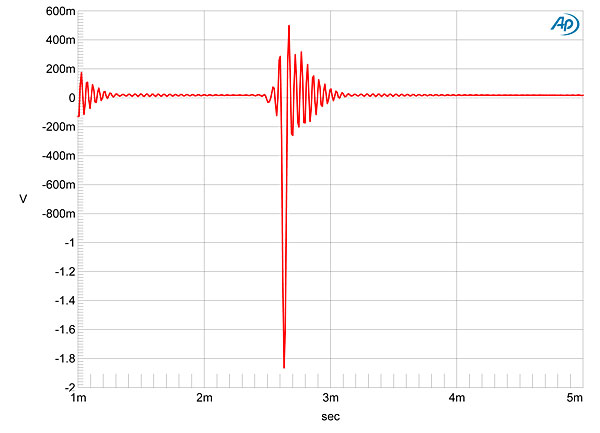
In its promotional material, Questyle refers to its digital reconstruction filter as being an Infinite Impulse Response (IIR) type, with all the ringing in its impulse response occurring after the impulse. To test a digital product's impulse response, I created a 44.1kHz WAV file with a single sample at the maximum level and all other samples at digital zero. Fig.1 shows the QP1R's behavior with this file, taken from the headphone output. As expected, the impulse is inverted, and almost all the ringing does occur after the event, as is typical of a minimum-phase filter.
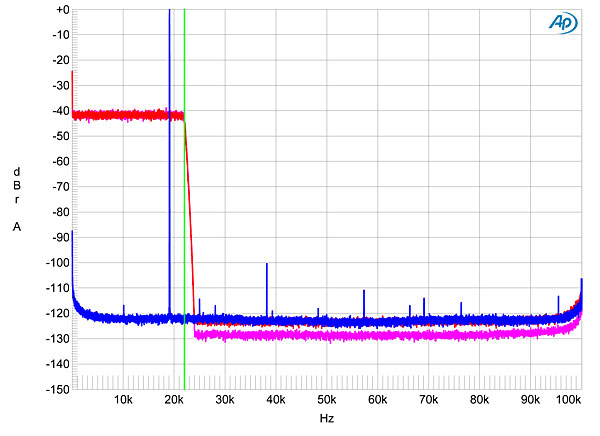
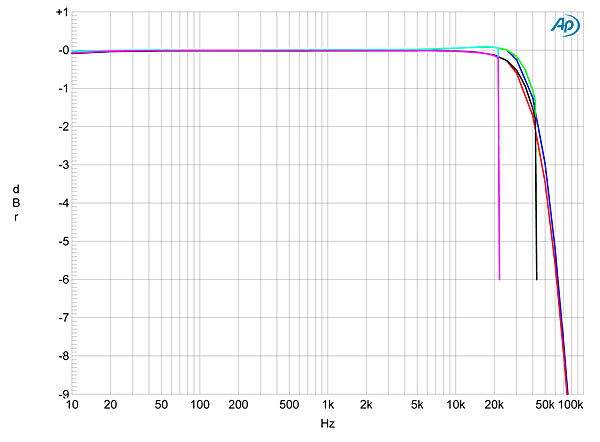
The red and magenta traces in fig.2 reveal that this filter rolls off the output very rapidly above half the sample rate (vertical green line), with maximum attenuation reached at 24kHz. The aliased image at 25kHz of a full-scale 19.1kHz tone is therefore suppressed by 115dB (blue and cyan traces). Note also the very low level of distortion harmonics in this graph. Fig.3 shows a more conventional frequency-response graph, taken with data sampled at 44.1, 96, and 192kHz. (Although I have a test-tone WAV file sampled at 384kHz, I got a "Not Support The Format" message when I tried to play it with the QP1R, as expected from the specifications.) The two channels' responses differed slightly but probably insignificantly above 10kHz, with the right channel (magenta, gray, and red traces) rolling off very slightly earlier than the left (cyan, green, blue). The overall response conforms to the same basic shape at all three sample rates, with a sharp rolloff just below half the rate at 44.1 and 96kHz.
Channel separation at 1kHz was excellent, at >105dB in both directions, but at 20Hz decreased to 80dB R–L and 90dB L–R, presumably due to increasing power-supply impedance at low frequencies. Fed dithered data representing a 1kHz tone at –90dBFS with first 16-bit data (fig.4, cyan and magenta traces), then 24-bit data (blue, red), the increase in bit depth dropped the noise floor by 13dB or so, suggesting resolution of at least 18 bits. Peculiarly, the 16-bit trace has slight peaks at 2 and 4kHz that are absent from the 24-bit traces, and the player's reproduction of a dithered 24-bit tone at –120dBFS also features a regular series of harmonics (fig.5). While this behavior should have no audible consequences, there appears to be something not quite right with how the QP1R handles very low-level data. Even so, while a small amount of DC offset can be seen, the QP1R handled undithered PCM data at exactly –90.31dBFS in textbook fashion (fig.6), with the three DC voltage levels described by the data well differentiated.
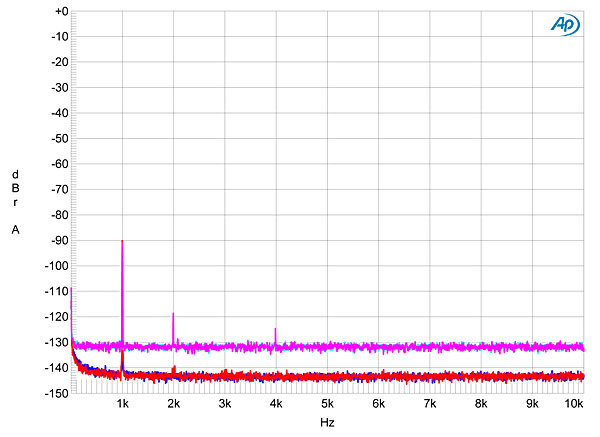
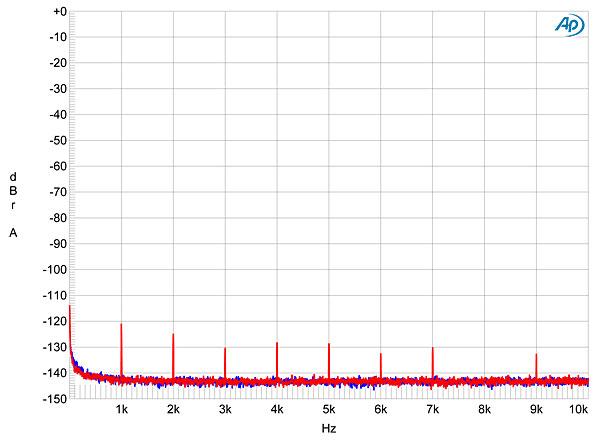
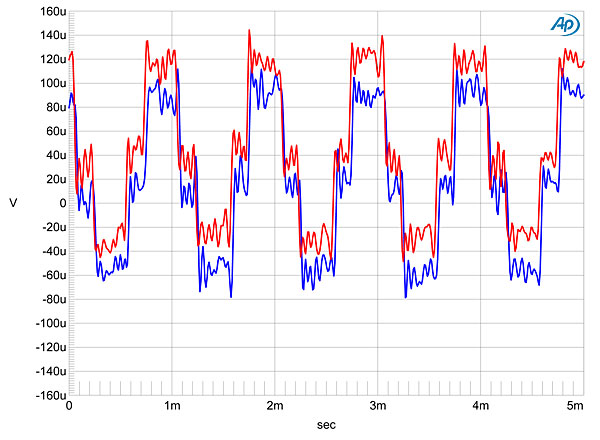
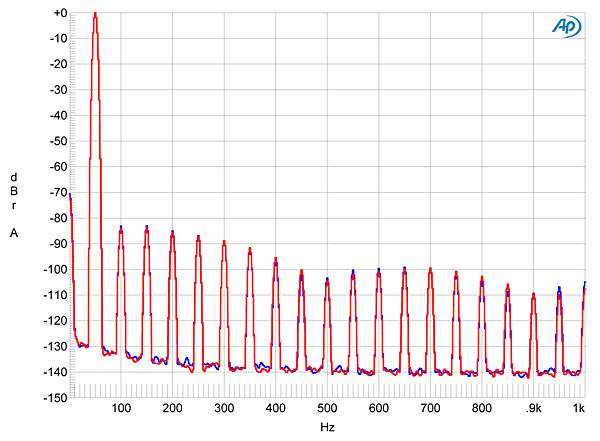
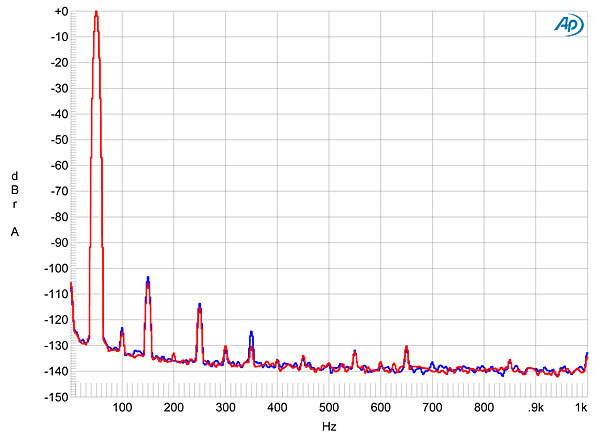
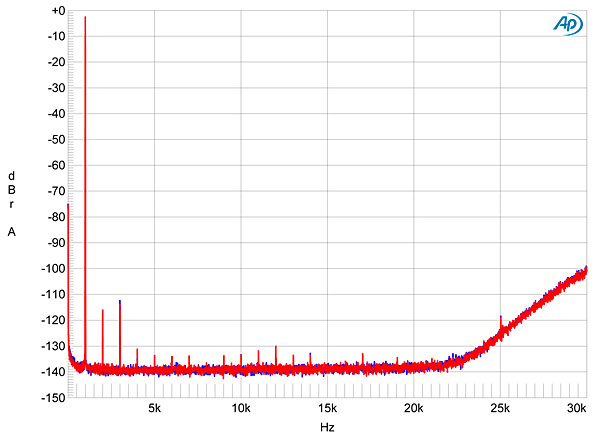
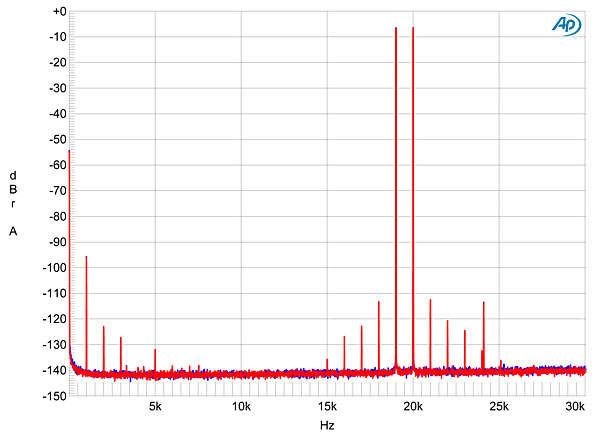
Fig.7 shows a spectral analysis of the Questyle's output while decoding a full-scale 50Hz tone. The volume control was at its maximum, and when I looked at the oscilloscope screen, the top halves of the waveform were beginning to clip, which is why a picket fence of low-level distortion harmonics can be seen. Reducing the volume by 2.5dB eliminated the clipping, and now only some odd-order harmonics are visible (fig.8), with the third the highest in level at –104dB (0.0006%). The distortion was even lower with DSD64 data (fig.9). Intermodulation distortion was also extremely low, even with the volume control set to its maximum (fig.10).
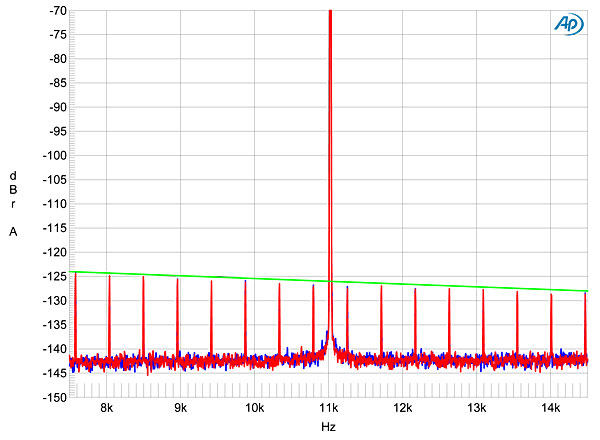
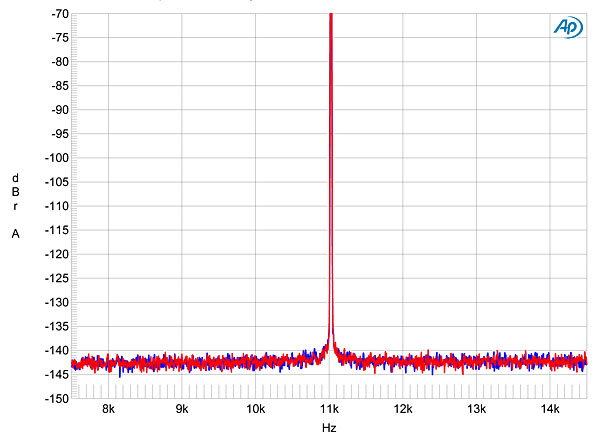
The Miller-Dunn J-Test signal is not diagnostic for systems in which the bit clock is not embedded in the data. Nevertheless, I routinely include it in my tests of digital products, and with 16-bit data the QP1R performed very well: All the odd-order harmonics of the low-frequency, LSB-level squarewave were reproduced at the correct level, as indicated by the green line in fig.11 With 24-bit data, nothing could be seen above the noise floor, other than the central spike at one-quarter the sample rate (fig.12).
Other than its slightly idiosyncratic handling of very low-level signals, the Questyle QP1R's measured performance was excellent.—John Atkinson


