Sidebar 3: Measurements
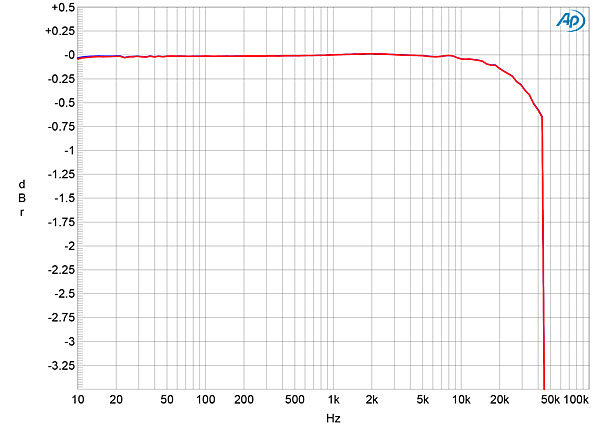
I first looked at the behavior of the Piega Connect wireless control unit, using my Audio Precision SYS2722 analyzer. Measured at its analog output jacks in variable mode, this had a maximum gain of 0.3dB. The fixed mode offered the same 0.3dB gain. The analog input clipped at 2.2V. A 1kHz signal at –12dBFS at the coaxial and optical digital inputs resulted in a level at the analog outputs of 534mV, suggesting that the Connect's gain architecture is very similar for both analog and digital signals. Both digital inputs locked on to data sampled at rates from 44.1kHz to 192kHz, but when I looked at the frequency response with a 192kHz stream, it appeared that the data were downsampled to 96kHz (fig.1).
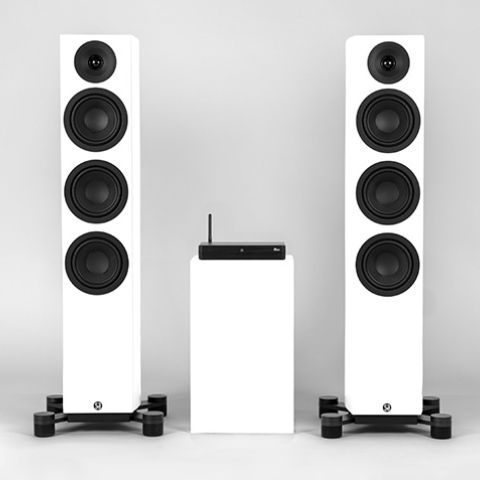
 Turning to the Wireless 701 loudspeaker, I used DRA Labs' MLSSA system to measure the farfield behavior with a calibrated DPA 4006 microphone. Because Julie Mullins had performed most of her critical listening with the magnetically attached grille in place, the farfield measurements were performed with the grille. I then repeated some without the grille. For the speaker's nearfield responses, I used an Earthworks QTC-40 mike, which has a small ¼"-diameter capsule that doesn't obstruct the radiation from the woofers or port. I performed all the acoustic measurements using the loudspeaker's analog input, which appears to have a high input impedance, then repeated some tests via Wi-Fi from the control unit.
I found an anomaly with the Wi-Fi connection. The Connect and speakers can be linked with three different networks, labeled white, blue, and red. These colors correspond to the color of the LEDs on the three products' rear panels. I started measuring using the white Wi-Fi connection, which is the factory-default setting. However, the measurements were limited to a bandwidth of 24kHz, ie, a sample rate of 48kHz. Checking the manual revealed that the white and blue connections are limited to 24/48k data and that only the red connection would operate at a 96kHz rate. I therefore rebooted the Connect and the 701 speakers so that they were linked with the red connection. The system's Wi-Fi frequency was set to 5.2GHz, which Piega recommends using "whenever possible." The bandwidth was still limited to 24kHz, however, even though I checked that I was sending 24/96k data to the Piega Connect via TosLink.
Piega doesn't specify the 701's sensitivity. I found that sending a 100mV MLS signal to the speaker's analog input resulted in an spl of 85.3dB(B) at the 50" microphone distance I use for my farfield measurements. The Wireless 701s will play very loudly with full-scale digital data.
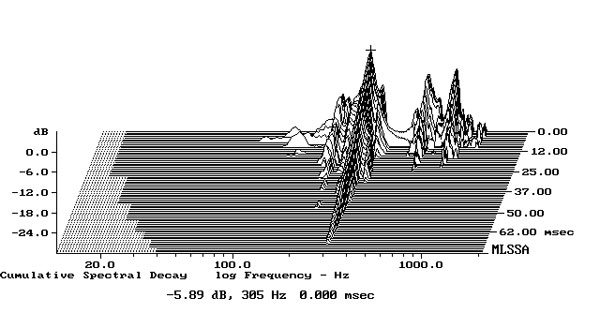
When I investigated the enclosure's vibrational behavior with a plastic-tape accelerometer, I found some modes on the sidewalls (fig.2). The highest in level was at 305Hz, with lower-level modes at 203Hz, 355Hz, and 1200Hz. Because these modes all have a very high Q (Quality Factor), they might not have much of an effect on the speaker's sound quality.
Turning to the Wireless 701 loudspeaker, I used DRA Labs' MLSSA system to measure the farfield behavior with a calibrated DPA 4006 microphone. Because Julie Mullins had performed most of her critical listening with the magnetically attached grille in place, the farfield measurements were performed with the grille. I then repeated some without the grille. For the speaker's nearfield responses, I used an Earthworks QTC-40 mike, which has a small ¼"-diameter capsule that doesn't obstruct the radiation from the woofers or port. I performed all the acoustic measurements using the loudspeaker's analog input, which appears to have a high input impedance, then repeated some tests via Wi-Fi from the control unit.
I found an anomaly with the Wi-Fi connection. The Connect and speakers can be linked with three different networks, labeled white, blue, and red. These colors correspond to the color of the LEDs on the three products' rear panels. I started measuring using the white Wi-Fi connection, which is the factory-default setting. However, the measurements were limited to a bandwidth of 24kHz, ie, a sample rate of 48kHz. Checking the manual revealed that the white and blue connections are limited to 24/48k data and that only the red connection would operate at a 96kHz rate. I therefore rebooted the Connect and the 701 speakers so that they were linked with the red connection. The system's Wi-Fi frequency was set to 5.2GHz, which Piega recommends using "whenever possible." The bandwidth was still limited to 24kHz, however, even though I checked that I was sending 24/96k data to the Piega Connect via TosLink.
Piega doesn't specify the 701's sensitivity. I found that sending a 100mV MLS signal to the speaker's analog input resulted in an spl of 85.3dB(B) at the 50" microphone distance I use for my farfield measurements. The Wireless 701s will play very loudly with full-scale digital data.
When I investigated the enclosure's vibrational behavior with a plastic-tape accelerometer, I found some modes on the sidewalls (fig.2). The highest in level was at 305Hz, with lower-level modes at 203Hz, 355Hz, and 1200Hz. Because these modes all have a very high Q (Quality Factor), they might not have much of an effect on the speaker's sound quality.
 These nearfield measurements were taken with the 701's rear-panel switch set to Neutral. Setting it to Wall shelved down the outputs of the woofers and port by around 2dB below 120Hz. Setting it to Corner increased the reduction in low-frequency level by up to 5dB, with the turnover frequency increased to 200Hz.
The Piega's horizontal radiation pattern, with each off-axis response normalized to the response on the tweeter axis, is shown in fig.4. The upper woofer becomes directional at the top of its passband, indicated by the gully centered on 2kHz in the output to the speaker's sides. The tweeter's dispersion at the bottom of its passband is wide, but the drive-unit then becomes very directional above 8kHz. In the vertical plane (fig.5), a suckout centered on 3.9kHz appears more than 5° above the tweeter axis, which is 38" from the floor. The Piega maintains its tweeter-axis response over a ±5° vertical window, however.
These nearfield measurements were taken with the 701's rear-panel switch set to Neutral. Setting it to Wall shelved down the outputs of the woofers and port by around 2dB below 120Hz. Setting it to Corner increased the reduction in low-frequency level by up to 5dB, with the turnover frequency increased to 200Hz.
The Piega's horizontal radiation pattern, with each off-axis response normalized to the response on the tweeter axis, is shown in fig.4. The upper woofer becomes directional at the top of its passband, indicated by the gully centered on 2kHz in the output to the speaker's sides. The tweeter's dispersion at the bottom of its passband is wide, but the drive-unit then becomes very directional above 8kHz. In the vertical plane (fig.5), a suckout centered on 3.9kHz appears more than 5° above the tweeter axis, which is 38" from the floor. The Piega maintains its tweeter-axis response over a ±5° vertical window, however.
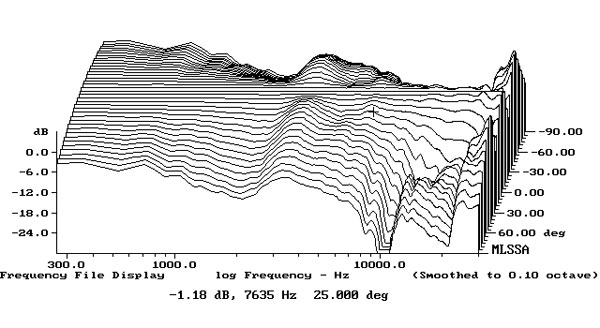
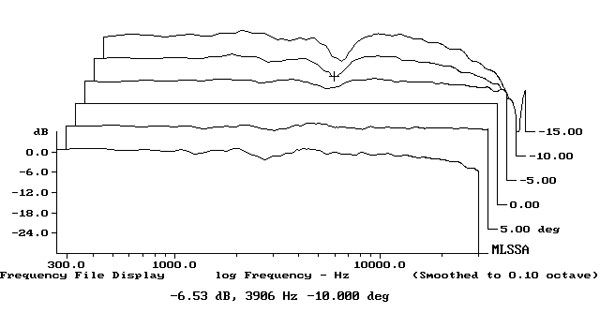
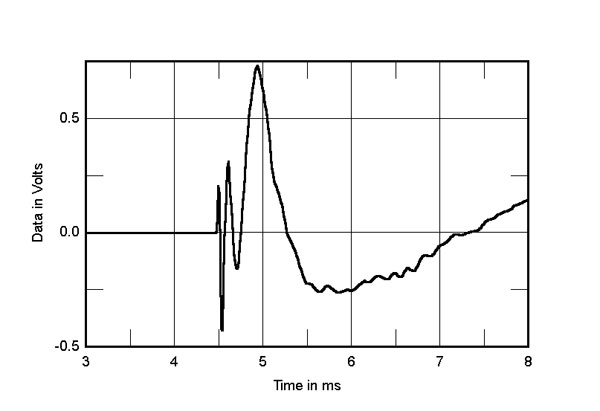
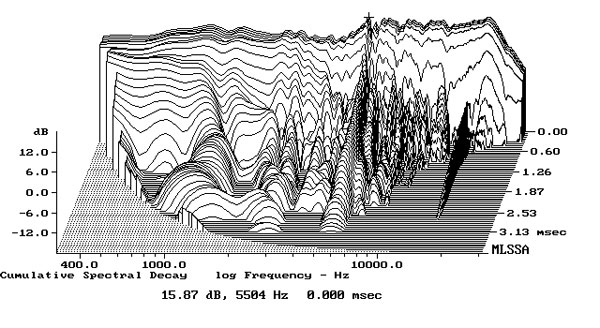
Fig.1 Piega Connect, frequency response at –12dBFS into 100k ohms with data sampled at 192kHz (left channel blue, right red) (0.5dB/vertical div.).
The analog input impedance was 14k ohms from 20Hz to 20kHz. The analog output impedance was a usefully low 460 ohms, and the Connect preserved absolute polarity. Channel separation was >110dB at all audio frequencies. Distortion just below clipping was very low, with the third harmonic the highest in level at just –96dB (0.0015%).
Fig.2 Piega 701, cumulative spectral-decay plot calculated from output of accelerometer fastened to center of sidewall level with upper woofer (MLS driving voltage to speaker, 250mV; measurement bandwidth, 2kHz).
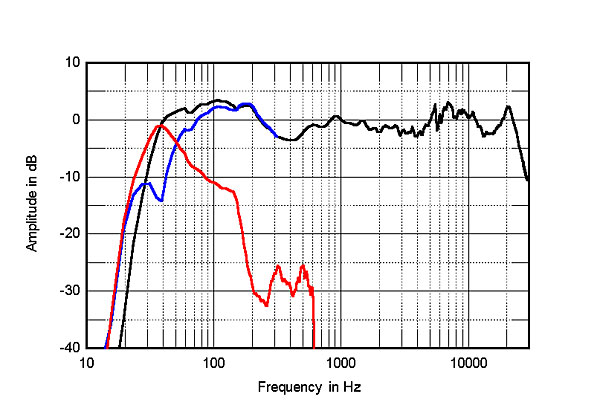
The black trace above 300Hz in fig.3 shows the Piega 701's farfield response, averaged across a 30° horizontal window centered on the tweeter axis. The response in the upper midrange and low treble is flat, though there is then a slight lack of energy apparent in the presence region and a slight excess in the octave between 5kHz and 10kHz. This measurement was made with the grille; repeating it without the grille had no effect on the response below 8kHz but resulted in 3–5dB more energy in the top audio octave. Removing the grille also eliminated the slight peak at 20kHz.
Fig.3 Piega 701, anechoic response with grille on tweeter axis at 50", averaged across 30° horizontal window and corrected for microphone response (black), with the nearfield responses of the woofers (blue) and port (red), respectively plotted below 300Hz and 600Hz, and the complex sum of the nearfield woofer and port responses plotted below 300Hz (black).
The two woofers behave differently. The lower woofer rolls off gently above 150Hz, leaving the upper woofer to continue up to the crossover frequency to the tweeter. The blue trace in fig.3 shows the sum of the nearfield woofer outputs. Its minimum-motion notch, which is when the back pressure from the port resonance holds the cones stationary, lies at 39Hz. The nearfield response of the port (red trace) peaks broadly between 30Hz and 60Hz, with a clean upper-frequency rolloff.
The black trace below 300Hz in fig.3 and 5 shows the sum of the Piega's nearfield woofer and port outputs, taking into account acoustic phase and the different distance of each radiator from a nominal farfield microphone position. The usual excess of upper-bass energy due to the nearfield measurement technique is evident, but the lower midrange is still shelved down by around 3dB. This is something you often see in so-called two-and-a-half–way designs. The summed output rolls off rapidly below the port tuning frequency due to the presence of a high-pass filter to protect the relatively small woofers from being overloaded at subsonic frequencies.
Fig.4 Piega 701, lateral response family at 50", normalized to response on tweeter axis, from back to front: differences in response 90–5° off axis, reference response, differences in response 5–90° off axis.
Fig.5 Piega 701, vertical response family at 50", normalized to response on tweeter axis, from back to front: differences in response 15–5° above axis, reference response, differences in response 5–10° below axis.
In the time domain, the Piega 701's step response on the tweeter axis (fig.6) indicates that all three drive-units are connected in positive acoustic polarity. The tweeter's step arrives first at the microphone, and the decay of the 701's step is overlaid with high-frequency ringing, which correlates with a ridge of delayed energy just below 6kHz in the Piega's cumulative spectral-decay plot (fig.7). (As always with my CSD plots, ignore the small ridge just below 17kHz, which is due to interference from the computer monitor's line-scan frequency.) This plot was taken with the grille in place. Removing it didn't change this behavior.
Fig.6 Piega 701, step response on tweeter axis at 50" (5ms time window, 30kHz bandwidth).
Fig.7 Piega 701, cumulative spectral-decay plot on tweeter axis at 50" (0.15ms risetime).
Though the Piega Premium Wireless 701's on-axis balance has too much mid-treble energy, this can be adjusted by experimenting with toe-in.—John Atkinson