
The Evolution T6's A1 monoblock amplifier doesn't have enough heatsink area to enable it to run at high power for long periods of time. It shut itself down after driving 70W into 8 ohms for 15 minutes, the top of its chassis too hot to keep my hand on. The amp worked fine after cooling down, so owners should make sure they keep the A1 well ventilated. It ran warm during my auditioning but never shut down. The A1's input impedance was 14k ohms unbalanced and 26k ohms balanced, and it didn't invert signal polarity. The unbalanced voltage gain was 28.25dB into 8 ohms; unusually, it was slightly lower for balanced drive, at 27.8dB. The output impedance measured a fairly low 0.125 ohm across the audioband; as a result, the amplifier's response (not shown) won't be affected significantly by the speaker's impedance. The response was flat down to 20Hz, and down just 0.2dB at 10Hz.
The A1's A-weighted signal/noise ratio (ref. 1W into 8 ohms) was respectable, at 82.6dB, this decreasing to 72.7dB when taken wideband, unweighted. Fig.1 shows that the percentage of THD+noise in the A1's output varies with increasing output power into 8, 4, and 2 ohms. The downward slope of the graphs indicates that the measured figure is dominated by noise rather than distortion right up to the point where it starts to clip. The A1 exceeds its specified power, delivering 216W into 8 ohms (23.3dBW), 340W into 4 ohms (22.3dBW), and 440W into 2 ohms (20.4dBW), though it heated up rapidly driving the latter load.
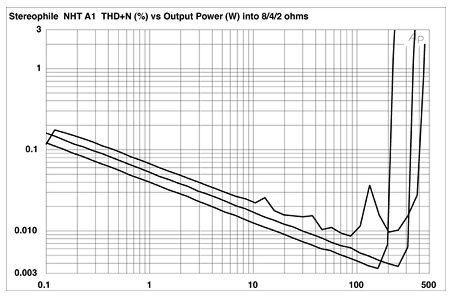
Fig.1 NHT A1, distortion (%)vs 1kHz continuous output power into (from bottom to top at 100W): 8 ohms, 4 ohms, 2 ohms.
Even at high powers, I found it hard to find distortion harmonics at any significant level. Fig.2 shows the spectrum of the NHT's output while it drove a 50Hz sinewave at 176W into 4 ohms: all the harmonics lie below –100dB (0.001%). However, looking at the oscilloscope while I performed these tests indicated that there were some spiky artifacts in the amplifier's output at these high levels, these occurring four times per cycle. Presumably due to the switching of the power-supply rails in this class-G design, they can be seen in the waveform of the distortion spuriae taken with a 100Hz tone at 60W into 4 ohms (fig.3). These are still very low in level—the THD+N was just 0.004% in this graph—and disappeared at lower powers (fig.4).
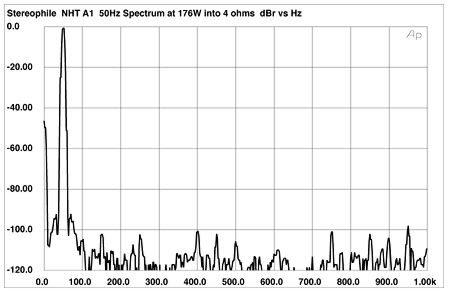
Fig.2 NHT A1, spectrum of 50Hz sinewave, DC–1kHz, at 176W into 4 ohms (linear frequency scale).

Fig.3 NHT A1, 100Hz waveform at 60W into 4 ohms (top), 0.004% THD+N; distortion and noise waveform with fundamental notched out (bottom, not to scale).
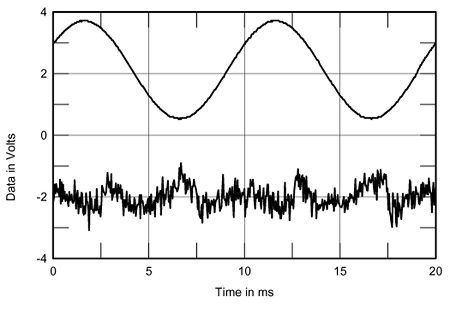
Fig.4 NHT A1, 100Hz waveform at 6W into 4 ohms (top), 0.0135% THD+N; distortion and noise waveform with fundamental notched out (bottom, not to scale).
Turning to the X1 crossover, even with its 15V wall-wart AC supply it proved capable of swinging almost 15V at clipping from either set of outputs. Plotting its THD+N vs output voltage graph (fig.5) indicated that the X1 achieved its best performance between 1V and 5V output, which is where it will be working in a typical system. In unbalanced mode, the X1's dominant harmonic was the subjectively innocuous second (fig.6), this disappearing as expected with balanced operation. Driving the low 600 ohm load caused some higher-order harmonics to appear with both unbalanced and balanced operation, and there was a little more intermodulation distortion than I like to see, the 1kHz difference tone resulting from an equal mix of 19kHz and 20kHz tones lying at –82dB (0.008%, fig.7). But as long as the X1 is used with power amps having input impedances of 10k ohms or more, the X1 will deliver high linearity.
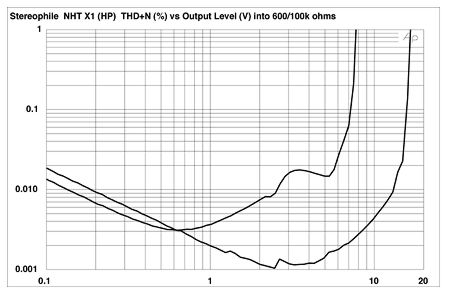
Fig.5 NHT X1, high-pass output, distortion (%)vs 1kHz output voltage into (from bottom to top): 100k ohms, 600 ohms.
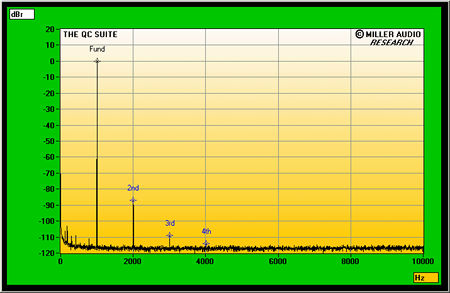
Fig.6 NHT X1, spectrum of 1kHz sinewave, DC–1kHz, at 1V into 8k ohms (linear frequency scale).
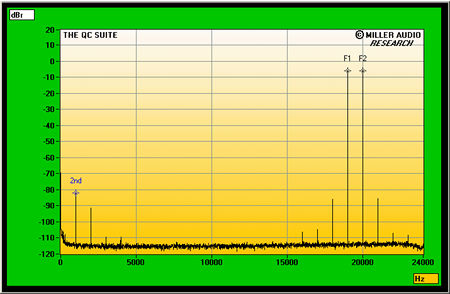
Fig.7 NHT X1, HF intermodulation spectrum, DC–24kHz, 19+20kHz at 1V into 8k ohms (linear frequency scale).
The X1's own input impedance was a moderately high 14k ohms unbalanced and 26k ohms balanced, and it didn't invert signal polarity from its high-pass outputs. (The low-pass outputs have continuously adjustable phase.) The high-pass output impedance was a low 120 ohms unbalanced at 1kHz and double that figure from the balanced jacks, while the high-pass outputs, measured at 30Hz, were slightly higher, at 171 and 379 ohms, respectively. The voltage gain was 0dB unbalanced in and out, and 5.84dB balanced in and out, from the high-pass outputs. The gain was adjustable from the low-pass outputs, with maxima of 31.3dB available with the 0dB setting and 41.3dB with the 10dB setting.
The X1's high-pass filter rolled off the low frequencies with a 12dB/octave slope. The "110," "80," and "50" frequency settings corresponded closely with the actual –3dB points (fig.8, right-hand traces). The X1's low-pass slopes, shown to the left of this graph, at first glance look very similar, differing only above 80Hz or so, where you wouldn't think it mattered. However, remember that not only is the X1 acting as a crossover, it is also supplying the necessary bass equalization for the B6.
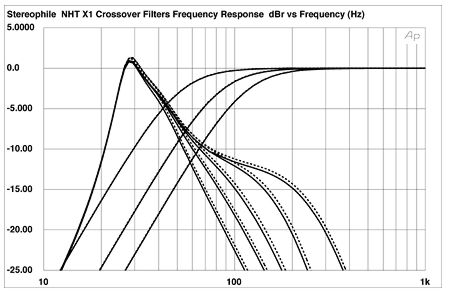
Fig.8 NHT X1, frequency response of high-pass and low-pass outputs, Boundary EQ set to "0" (5dB/vertical div., right channel dashed).
The B6 subwoofer's impedance plot is shown in fig.9. Its sealed-box alignment results in a big impedance peak at 53Hz, which without equalization would imply a –6dB point at the same frequency (footnote 1); ie, not much in the way of bass extension. However, the slow, 12dB/octave rolloff below resonance of a sealed-box system means that only a modest EQ boost is required to flatten and extend the bass response. Fig.10 shows the B6's nearfield response without the X1 (black trace) and with it, set to its various low-pass frequencies (colored traces). The EQ seen in fig.8 results in a 12dB boost at 32Hz, which flattens the B6's output down to that frequency, with a steep 36dB/octave rolloff below 30Hz. At the other end of the B6's passband, this graph shows that the indicated low-pass frequency accurately corresponds to the –3dB point. The traces in fig.11, again taken in the B6's nearfield but with the low-pass frequency set to "140," show the effects of the X1's Boundary EQ control: It adds or removes energy in the 40Hz band up to maxima of ±7dB. Fig.12 shows the final X1 filter settings I used for my auditioning of the T6 system.—John Atkinson
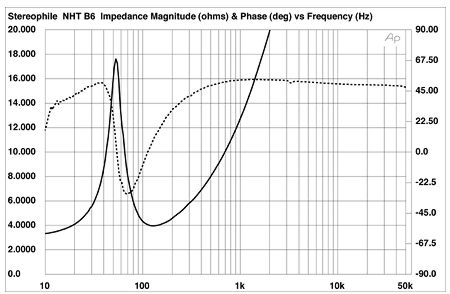
Fig.9 NHT Evolution B6, electrical impedance (solid) and phase (dashed). (2 ohms/vertical div.)
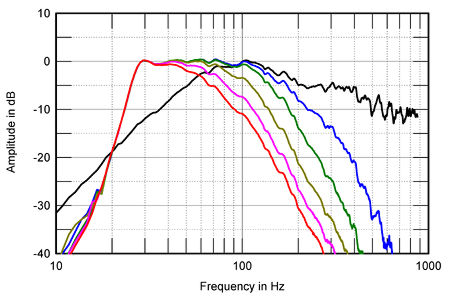
Fig.10 NHT Evolution B6, nearfield frequency response without X1 (black) and with X1 set to 50–140Hz (colored traces), Boundary EQ set to "0."
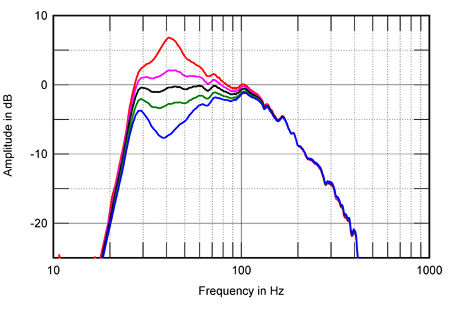
Fig.11 NHT Evolution B6, nearfield frequency response with X1 Low Pass set to "140Hz" and Boundary EQ set to "+6" (red), "+3" (pink), "0" (black), "–3" (green), and "–6" (blue).
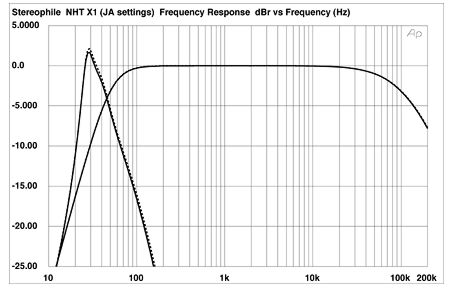
Fig.12 NHT X1, final filter settings used for auditioning.
Footnote 1: My thanks to reader David Meraner, who reminds me that the F3 point of a closed system is a function of its Qtc and the frequency of maximum impedance, Fc. Only when Qtc = 0.707 does F3 equal Fc. Using my curves, Mr. Meraner estimated the NHT B6's system Qtc to be 0.65, and its F3 to be 58Hz.— John Atkinson


