Sidebar 3: Measurements
I used Stereophile's loan sample of the top-of-the-line Audio Precision SYS2722 system to measure the DU-50 (see www.ap.com and the January 2008 "As We See It"; for some tests, I also used my Audio Precision System One Dual Domain and the Miller Audio Research Jitter Analyzer. I turned off the DU-50's video outputs for all measurements, but did do a few comparisons with them on and off. Neither the character of the noise floor nor the level or spectrum of the jitter appeared to be significantly changed by the video circuitry.
The DU-50's maximum output at 1kHz was the same for CD and DVD-Audio from the balanced and unbalanced outputs, at 2.04V RMS—just 0.15dB higher than the CD standard's 2V. However, with SACD, the maximum output dropped by 3.15dB, to 1.42V. The unbalanced output preserved absolute polarity (ie, was non-inverting) but the balanced output didn't, suggesting that the latter's XLR jacks are wired with pin 3 hot, the opposite of the AES standard. The unbalanced output impedance was a fairly low 300 ohms over most of the audioband, rising very slightly to 320 ohms at 20Hz. The balanced output impedance was significantly higher, however, at 1180 ohms. Error correction was good rather than great, the DU-50 suffering from audible glitches in its output with track 30 of the Pierre Verany Test CD, which has 0.75mm gaps in the data spiral.
Fig.1 shows the impulse response of the DU-50's Normal DAC. It has characteristics of both linear- and minimum-phase low-pass filters, with some pre-ringing, but most of the filter's ringing occurs after the impulse. By contrast, fig.2 shows the impulse response of the Fluency DAC. Like the old Wadia Digimaster and Pioneer Legato Linear reconstruction filters, there is neither pre- nor post-ringing. However, the price paid for this superb time-domain performance includes a frequency response that rolls off prematurely in the top octave (fig.3, cyan and magenta traces; fig.4, green, gray), reaching –3dB at 20kHz, compared with the Normal DAC, which is flat throughout the audioband (fig.3, blue, red).
 Fig.1 Luxman DU-50, Normal DAC, response to single sample at 0dBFS, 44.1kHz-sampled data (4ms time window).
 Fig.2 Luxman DU-50, Fluency DAC, response to single sample at 0dBFS, 44.1kHz-sampled data (4ms time window).
 Fig.3 Luxman DU-50, frequency response at –12dBFS into 100k ohms with data sampled at 44.1kHz and Normal DAC (left channel blue, right red), and with Fluency DAC (left cyan, right magenta; 0.25dB/vertical div.).
The Fluency DAC's top-octave rolloff doubles in frequency with 96kHz data from DVD-A (fig.4, cyan, magenta), but even then, the ultrasonic response is a little more extended than with SACD (fig.4, blue, red), which is 4dB down at 40kHz and –30dB at 100kHz. Channel separation from both balanced and unbalanced outputs was superb, any crosstalk lying more than 120dB down at all frequencies.
Fig.3 Luxman DU-50, frequency response at –12dBFS into 100k ohms with data sampled at 44.1kHz and Normal DAC (left channel blue, right red), and with Fluency DAC (left cyan, right magenta; 0.25dB/vertical div.).
The Fluency DAC's top-octave rolloff doubles in frequency with 96kHz data from DVD-A (fig.4, cyan, magenta), but even then, the ultrasonic response is a little more extended than with SACD (fig.4, blue, red), which is 4dB down at 40kHz and –30dB at 100kHz. Channel separation from both balanced and unbalanced outputs was superb, any crosstalk lying more than 120dB down at all frequencies.
 Fig.4 Luxman DU-50, Fluency DAC, frequency response at –12dBFS into 100k ohms with data sampled at: 44.1kHz from CD (left channel green, right gray); 96kHz from DVD-A (left cyan, right magenta); and from SACD with Normal DAC (left blue, right red; 0.25dB/vertical div.).
For consistency with my previously published tests of digital components, I first examine resolution by sweeping a 1/3-octave–wide bandpass filter from 20kHz to 20Hz while the device under test decodes dithered data representing a 1kHz tone at –90dBFS. The middle pair of traces in fig.5 shows the spectrum of the Luxman's output with CD playback. The traces peak at exactly –90dBFS, implying very low linearity error, and the background noise is actually that of the recorded dither noise, other than a peak at the AC-supply frequency of 60Hz, which is probably due to magnetic coupling from the power transformer. Playing back dithered 24-bit data from DVD-A lowers the noise floor by up to 12dB (fig.5, bottom pair of traces), but the surprise in this graph is that SACD playback doesn't appear to offer any more resolution than CD: the noise floor at low frequencies (fig.5, top traces) is actually higher than that with CD.
Fig.4 Luxman DU-50, Fluency DAC, frequency response at –12dBFS into 100k ohms with data sampled at: 44.1kHz from CD (left channel green, right gray); 96kHz from DVD-A (left cyan, right magenta); and from SACD with Normal DAC (left blue, right red; 0.25dB/vertical div.).
For consistency with my previously published tests of digital components, I first examine resolution by sweeping a 1/3-octave–wide bandpass filter from 20kHz to 20Hz while the device under test decodes dithered data representing a 1kHz tone at –90dBFS. The middle pair of traces in fig.5 shows the spectrum of the Luxman's output with CD playback. The traces peak at exactly –90dBFS, implying very low linearity error, and the background noise is actually that of the recorded dither noise, other than a peak at the AC-supply frequency of 60Hz, which is probably due to magnetic coupling from the power transformer. Playing back dithered 24-bit data from DVD-A lowers the noise floor by up to 12dB (fig.5, bottom pair of traces), but the surprise in this graph is that SACD playback doesn't appear to offer any more resolution than CD: the noise floor at low frequencies (fig.5, top traces) is actually higher than that with CD.
 Fig.5 Luxman DU-50, Normal DAC, 1/3-octave spectrum with noise and spuriae of dithered 1kHz tone at –90dBFS with: 16-bit CD data (middle below 1kHz), 24-bit DVD-A data (bottom), and DSD SACD data (top below 1kHz). (Right channel dashed.)
Repeating the analysis for 16- and 24-bit PCM data with an FFT technique (fig.6) confirms the results shown in fig.5. The spectra shown in figs. 5 and 6 were taken with the Normal DAC. The Fluency DAC is somewhat noisier below 3kHz, which can be seen in fig.7, which compares the spectra of a dithered 16-bit tone at –90dBFS with the Fluency DAC (blue, magenta traces) with that of the Normal DAC (cyan, red). The rise in the noise floor below 3kHz with the Fluency DAC is very similar to the spectrum of the signal with SACD (not shown), except that CD data with the Fluency DAC is marred by odd-order harmonic distortion.
Fig.5 Luxman DU-50, Normal DAC, 1/3-octave spectrum with noise and spuriae of dithered 1kHz tone at –90dBFS with: 16-bit CD data (middle below 1kHz), 24-bit DVD-A data (bottom), and DSD SACD data (top below 1kHz). (Right channel dashed.)
Repeating the analysis for 16- and 24-bit PCM data with an FFT technique (fig.6) confirms the results shown in fig.5. The spectra shown in figs. 5 and 6 were taken with the Normal DAC. The Fluency DAC is somewhat noisier below 3kHz, which can be seen in fig.7, which compares the spectra of a dithered 16-bit tone at –90dBFS with the Fluency DAC (blue, magenta traces) with that of the Normal DAC (cyan, red). The rise in the noise floor below 3kHz with the Fluency DAC is very similar to the spectrum of the signal with SACD (not shown), except that CD data with the Fluency DAC is marred by odd-order harmonic distortion.
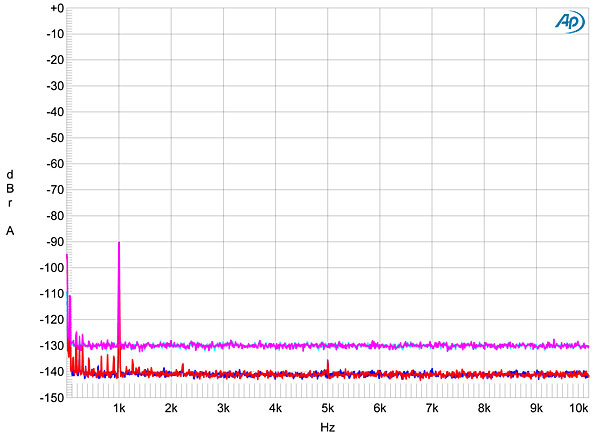 Fig.6 Luxman DU-50, Normal DAC, FFT-derived spectrum with noise and spuriae of dithered 1kHz tone at –90dBFS with: 16-bit data (left channel cyan, right magenta), 24-bit data (left blue, right red).
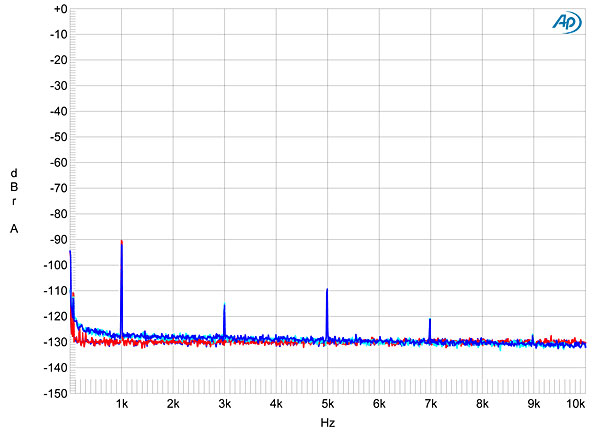 Fig.7 Luxman DU-50, FFT-derived spectrum with noise and spuriae of dithered 1kHz tone at –90dBFS with 16-bit data and: Normal DAC (left channel cyan, right red), Fluency DAC (left blue, right magenta).
With its excellent linearity and low noise, the Normal DAC gave an excellent reproduction of an undithered sinewave at exactly –90.3dBFS (fig.8), with a symmetrical waveform and a clear depiction of the three DC voltage levels described by this signal. By contrast, the extra harmonic components introduced by the Luxman's Fluency DAC resulted in a waveform that looks more like a sinewave (fig.9).
Fig.7 Luxman DU-50, FFT-derived spectrum with noise and spuriae of dithered 1kHz tone at –90dBFS with 16-bit data and: Normal DAC (left channel cyan, right red), Fluency DAC (left blue, right magenta).
With its excellent linearity and low noise, the Normal DAC gave an excellent reproduction of an undithered sinewave at exactly –90.3dBFS (fig.8), with a symmetrical waveform and a clear depiction of the three DC voltage levels described by this signal. By contrast, the extra harmonic components introduced by the Luxman's Fluency DAC resulted in a waveform that looks more like a sinewave (fig.9).
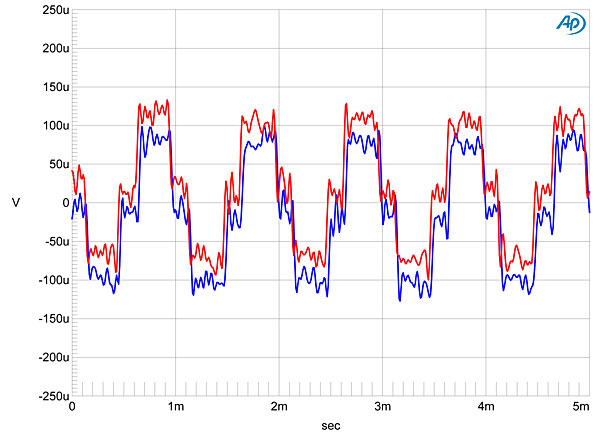 Fig.8 Luxman DU-50, Normal DAC, waveform of undithered 1kHz sinewave at –90.31dBFS, 16-bit data (left channel blue, right red).
 Fig.9 Luxman DU-50, Fluency DAC, waveform of undithered 1kHz sinewave at –90.31dBFS, 16-bit data (left channel blue, right red).
The DU-50's output stage can drive low impedances with low distortion, as shown by fig.10, the spectrum of its output as it drove a full-scale 50Hz sinewave into 600 ohms. The second and third harmonics are the highest in level, but are still down almost 110dB (0.0003%). Intermodulation distortion with both the Normal and Fluency DACs (figs. 11 and 12, respectively) is vanishingly low, but there is a peculiar rise in the noise floor to either side of the spectral peaks that represent the 19 and 20kHz tones. I have seen this behavior in some other universal players. You can see from these graphs that while the Normal DAC's filter suppresses ultrasonic images of the twin tones to –100dB (fig.11), the time-optimized Fluency DAC filter offers almost no suppression of these images, and that there is some low-level, lower-frequency aliasing (fig.12).
Fig.9 Luxman DU-50, Fluency DAC, waveform of undithered 1kHz sinewave at –90.31dBFS, 16-bit data (left channel blue, right red).
The DU-50's output stage can drive low impedances with low distortion, as shown by fig.10, the spectrum of its output as it drove a full-scale 50Hz sinewave into 600 ohms. The second and third harmonics are the highest in level, but are still down almost 110dB (0.0003%). Intermodulation distortion with both the Normal and Fluency DACs (figs. 11 and 12, respectively) is vanishingly low, but there is a peculiar rise in the noise floor to either side of the spectral peaks that represent the 19 and 20kHz tones. I have seen this behavior in some other universal players. You can see from these graphs that while the Normal DAC's filter suppresses ultrasonic images of the twin tones to –100dB (fig.11), the time-optimized Fluency DAC filter offers almost no suppression of these images, and that there is some low-level, lower-frequency aliasing (fig.12).
 Fig.10 Luxman DU-50, Normal DAC, spectrum of 50Hz sinewave, DC–1kHz, at 0dBFS into 600 ohms (left channel blue, right red; linear frequency scale).
 Fig.11 Luxman DU-50, Normal DAC, HF intermodulation spectrum, DC–24kHz, 19+20kHz at 0dBFS into 100k ohms (linear frequency scale).
 Fig.12 Luxman DU-50, Fluency DAC, HF intermodulation spectrum, DC–24kHz, 19+20kHz at 0dBFS into 100k ohms (linear frequency scale).
Looking at the Luxman DU-50's rejection of word-clock jitter with CD playback, the rise in the noise floor with the high-frequency tones obscured the residual harmonics of the low-frequency, LSB-level squarewave in the Miller/Dunn J-Test signal. However, the Miller Analyzer calculated that sidebands present at ±30.3, ±60, ±120, and ±180Hz, give a total of 271 picoseconds peak–peak in the left channel, 329ps p–p in the right. The last three sideband pairs are obviously power-supply related, but the ±30.3Hz sidebands are of unknown origin. This jitter level is low, but playing the same 16-bit signal from DVD-A dropped the jitter to 170ps p–p in both channels.
These numbers were taken with the Luxman's Normal DAC, and the magenta trace in fig.13 shows the spectrum of the DU-50's output while it played the J-Test signal from CD. Switching to the Fluency DAC added noise to either side of the central peak in the spectrum (fig.13, blue trace).
Fig.12 Luxman DU-50, Fluency DAC, HF intermodulation spectrum, DC–24kHz, 19+20kHz at 0dBFS into 100k ohms (linear frequency scale).
Looking at the Luxman DU-50's rejection of word-clock jitter with CD playback, the rise in the noise floor with the high-frequency tones obscured the residual harmonics of the low-frequency, LSB-level squarewave in the Miller/Dunn J-Test signal. However, the Miller Analyzer calculated that sidebands present at ±30.3, ±60, ±120, and ±180Hz, give a total of 271 picoseconds peak–peak in the left channel, 329ps p–p in the right. The last three sideband pairs are obviously power-supply related, but the ±30.3Hz sidebands are of unknown origin. This jitter level is low, but playing the same 16-bit signal from DVD-A dropped the jitter to 170ps p–p in both channels.
These numbers were taken with the Luxman's Normal DAC, and the magenta trace in fig.13 shows the spectrum of the DU-50's output while it played the J-Test signal from CD. Switching to the Fluency DAC added noise to either side of the central peak in the spectrum (fig.13, blue trace).
 Fig.13 Luxman DU-50, high-resolution jitter spectrum of analog output signal, 11.025kHz at –6dBFS, sampled at 44.1kHz with LSB toggled at 229Hz: 16-bit CD data with Fluency DAC (left channel blue, right red), and with Normal DAC (left cyan, right magenta). Center frequency of trace, 11.025kHz; frequency range, ±3.5kHz.
John Marks might have preferred the sound of the Luxman DU-50's Fluency DAC because of its time-optimized performance, but it does offer a prematurely rolled-off top octave, as well as slightly higher noise levels and only modest suppression of ultrasonic image energy. The mystery to me was the DU-50's relatively poor performance with SACD.—John Atkinson
Fig.13 Luxman DU-50, high-resolution jitter spectrum of analog output signal, 11.025kHz at –6dBFS, sampled at 44.1kHz with LSB toggled at 229Hz: 16-bit CD data with Fluency DAC (left channel blue, right red), and with Normal DAC (left cyan, right magenta). Center frequency of trace, 11.025kHz; frequency range, ±3.5kHz.
John Marks might have preferred the sound of the Luxman DU-50's Fluency DAC because of its time-optimized performance, but it does offer a prematurely rolled-off top octave, as well as slightly higher noise levels and only modest suppression of ultrasonic image energy. The mystery to me was the DU-50's relatively poor performance with SACD.—John Atkinson
Fig.1 Luxman DU-50, Normal DAC, response to single sample at 0dBFS, 44.1kHz-sampled data (4ms time window).
Fig.2 Luxman DU-50, Fluency DAC, response to single sample at 0dBFS, 44.1kHz-sampled data (4ms time window).
Fig.3 Luxman DU-50, frequency response at –12dBFS into 100k ohms with data sampled at 44.1kHz and Normal DAC (left channel blue, right red), and with Fluency DAC (left cyan, right magenta; 0.25dB/vertical div.).
Fig.4 Luxman DU-50, Fluency DAC, frequency response at –12dBFS into 100k ohms with data sampled at: 44.1kHz from CD (left channel green, right gray); 96kHz from DVD-A (left cyan, right magenta); and from SACD with Normal DAC (left blue, right red; 0.25dB/vertical div.).
For consistency with my previously published tests of digital components, I first examine resolution by sweeping a 1/3-octave–wide bandpass filter from 20kHz to 20Hz while the device under test decodes dithered data representing a 1kHz tone at –90dBFS. The middle pair of traces in fig.5 shows the spectrum of the Luxman's output with CD playback. The traces peak at exactly –90dBFS, implying very low linearity error, and the background noise is actually that of the recorded dither noise, other than a peak at the AC-supply frequency of 60Hz, which is probably due to magnetic coupling from the power transformer. Playing back dithered 24-bit data from DVD-A lowers the noise floor by up to 12dB (fig.5, bottom pair of traces), but the surprise in this graph is that SACD playback doesn't appear to offer any more resolution than CD: the noise floor at low frequencies (fig.5, top traces) is actually higher than that with CD.
Fig.5 Luxman DU-50, Normal DAC, 1/3-octave spectrum with noise and spuriae of dithered 1kHz tone at –90dBFS with: 16-bit CD data (middle below 1kHz), 24-bit DVD-A data (bottom), and DSD SACD data (top below 1kHz). (Right channel dashed.)
Repeating the analysis for 16- and 24-bit PCM data with an FFT technique (fig.6) confirms the results shown in fig.5. The spectra shown in figs. 5 and 6 were taken with the Normal DAC. The Fluency DAC is somewhat noisier below 3kHz, which can be seen in fig.7, which compares the spectra of a dithered 16-bit tone at –90dBFS with the Fluency DAC (blue, magenta traces) with that of the Normal DAC (cyan, red). The rise in the noise floor below 3kHz with the Fluency DAC is very similar to the spectrum of the signal with SACD (not shown), except that CD data with the Fluency DAC is marred by odd-order harmonic distortion.
Fig.6 Luxman DU-50, Normal DAC, FFT-derived spectrum with noise and spuriae of dithered 1kHz tone at –90dBFS with: 16-bit data (left channel cyan, right magenta), 24-bit data (left blue, right red).
Fig.7 Luxman DU-50, FFT-derived spectrum with noise and spuriae of dithered 1kHz tone at –90dBFS with 16-bit data and: Normal DAC (left channel cyan, right red), Fluency DAC (left blue, right magenta).
With its excellent linearity and low noise, the Normal DAC gave an excellent reproduction of an undithered sinewave at exactly –90.3dBFS (fig.8), with a symmetrical waveform and a clear depiction of the three DC voltage levels described by this signal. By contrast, the extra harmonic components introduced by the Luxman's Fluency DAC resulted in a waveform that looks more like a sinewave (fig.9).
Fig.8 Luxman DU-50, Normal DAC, waveform of undithered 1kHz sinewave at –90.31dBFS, 16-bit data (left channel blue, right red).
Fig.9 Luxman DU-50, Fluency DAC, waveform of undithered 1kHz sinewave at –90.31dBFS, 16-bit data (left channel blue, right red).
The DU-50's output stage can drive low impedances with low distortion, as shown by fig.10, the spectrum of its output as it drove a full-scale 50Hz sinewave into 600 ohms. The second and third harmonics are the highest in level, but are still down almost 110dB (0.0003%). Intermodulation distortion with both the Normal and Fluency DACs (figs. 11 and 12, respectively) is vanishingly low, but there is a peculiar rise in the noise floor to either side of the spectral peaks that represent the 19 and 20kHz tones. I have seen this behavior in some other universal players. You can see from these graphs that while the Normal DAC's filter suppresses ultrasonic images of the twin tones to –100dB (fig.11), the time-optimized Fluency DAC filter offers almost no suppression of these images, and that there is some low-level, lower-frequency aliasing (fig.12).
Fig.10 Luxman DU-50, Normal DAC, spectrum of 50Hz sinewave, DC–1kHz, at 0dBFS into 600 ohms (left channel blue, right red; linear frequency scale).
Fig.11 Luxman DU-50, Normal DAC, HF intermodulation spectrum, DC–24kHz, 19+20kHz at 0dBFS into 100k ohms (linear frequency scale).
Fig.12 Luxman DU-50, Fluency DAC, HF intermodulation spectrum, DC–24kHz, 19+20kHz at 0dBFS into 100k ohms (linear frequency scale).
Looking at the Luxman DU-50's rejection of word-clock jitter with CD playback, the rise in the noise floor with the high-frequency tones obscured the residual harmonics of the low-frequency, LSB-level squarewave in the Miller/Dunn J-Test signal. However, the Miller Analyzer calculated that sidebands present at ±30.3, ±60, ±120, and ±180Hz, give a total of 271 picoseconds peak–peak in the left channel, 329ps p–p in the right. The last three sideband pairs are obviously power-supply related, but the ±30.3Hz sidebands are of unknown origin. This jitter level is low, but playing the same 16-bit signal from DVD-A dropped the jitter to 170ps p–p in both channels.
Fig.13 Luxman DU-50, high-resolution jitter spectrum of analog output signal, 11.025kHz at –6dBFS, sampled at 44.1kHz with LSB toggled at 229Hz: 16-bit CD data with Fluency DAC (left channel blue, right red), and with Normal DAC (left cyan, right magenta). Center frequency of trace, 11.025kHz; frequency range, ±3.5kHz.
John Marks might have preferred the sound of the Luxman DU-50's Fluency DAC because of its time-optimized performance, but it does offer a prematurely rolled-off top octave, as well as slightly higher noise levels and only modest suppression of ultrasonic image energy. The mystery to me was the DU-50's relatively poor performance with SACD.—John Atkinson