I measured a different sample of the Leak Stereo 230, serial number LH000805CFD1195, than the one RS had auditioned. I performed the measurements using my Audio Precision SYS2722 system. I preconditioned the Stereo 230 by following the CEA's recommendation of running it at one-eighth the specified power into 8 ohms for 30 minutes. At the end of that time, the black grille on the amplifier's top panel was hot, at 118.1°F/47.9°C.
Looking first at the amplifier's behavior with its single-ended analog line input, with the Leak's volume control set to its maximum the voltage gain at 1kHz into 8 ohms measured 32.7dB from the speaker terminals, 0.6dB from the preamplifier output, and 10.37dB from the headphone output. The line input preserved absolute polarity (ie, was noninverting) from both output types, and the input impedance was slightly lower than the specified 10k ohms, at 8.23k ohms across the audioband.
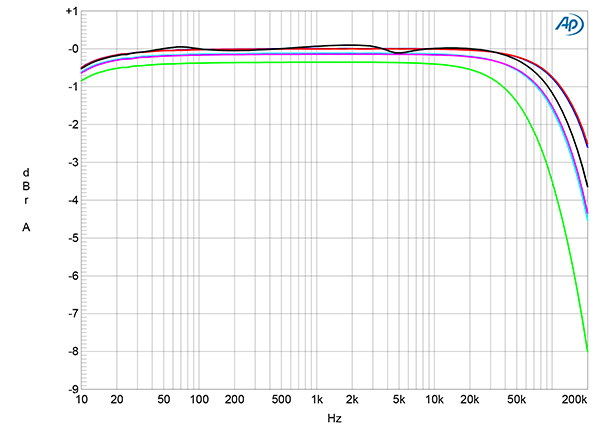
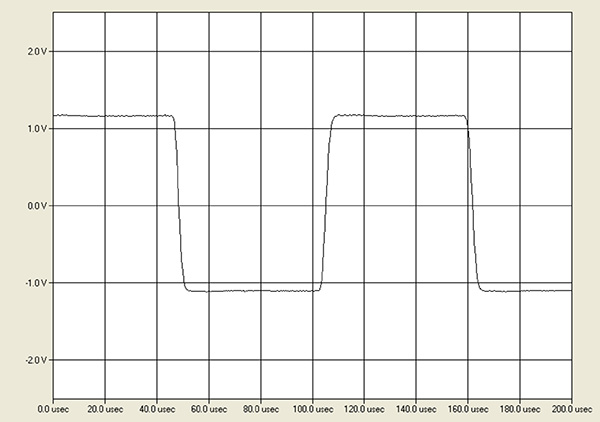
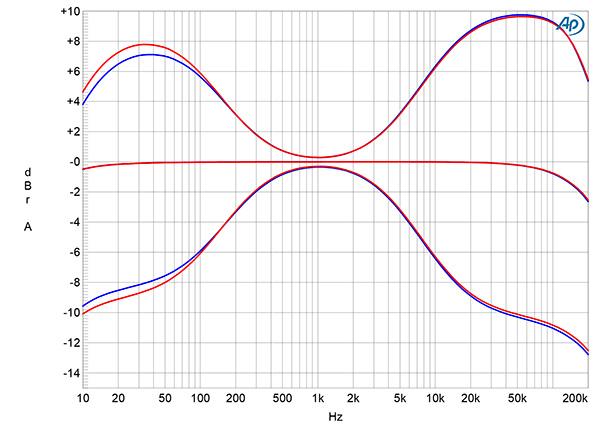
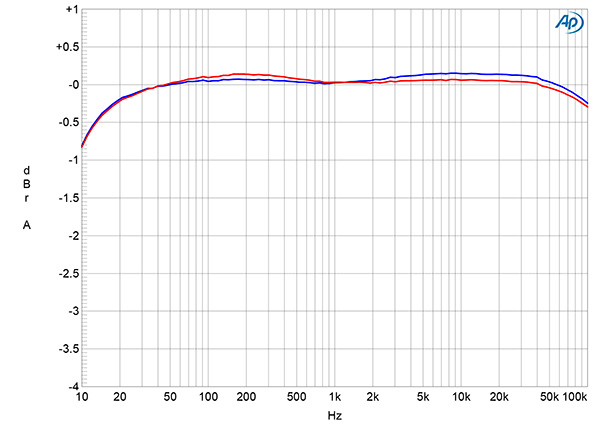
The preamplifier output impedance was a low 90 ohms from 20Hz to 20kHz; that at the headphone output was a very low 5 ohms, again at all audio frequencies. The loudspeaker output impedance was low at 20Hz and 1kHz, at 0.11 ohm, but rose to 0.14 ohm at 20kHz. (These values include the series resistance of 6' of spaced-pair speaker cable.) Consequently the variation in frequency response with our standard simulated loudspeaker (fig.1, gray trace) was minimal. The small-signal response into resistive loads (fig.1, blue, red, cyan, magenta, and green traces) didn't start to roll off until well above the audioband. Fig.1 was taken with the volume control set to its maximum; a 0.5dB difference, in favor of the left channel, appeared at lower settings of the control. The Stereo 230's reproduction of a 10kHz squarewave into 8 ohms (fig.2) featured short risetimes and no overshoot or ringing. The bass and treble controls offered boosts and cuts of up to ±10dB (fig.3).
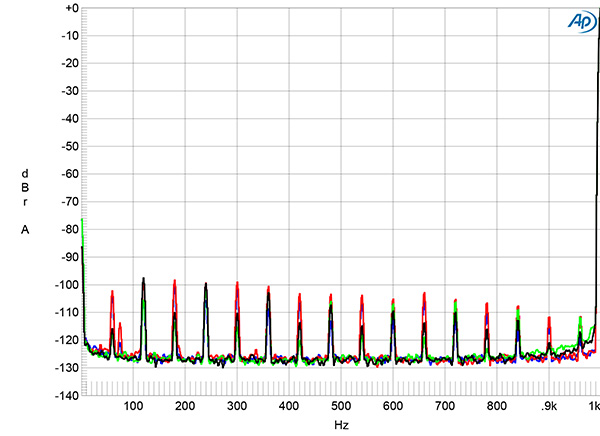
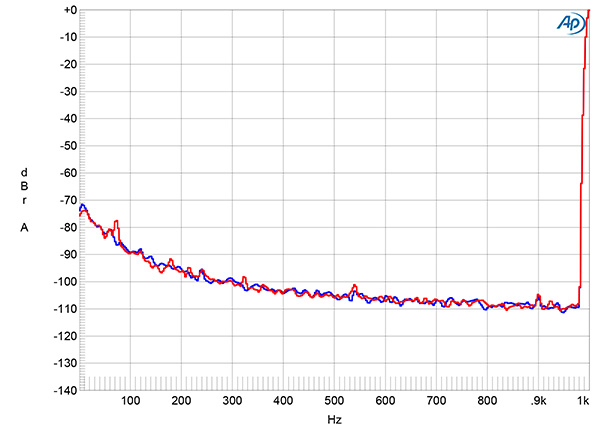
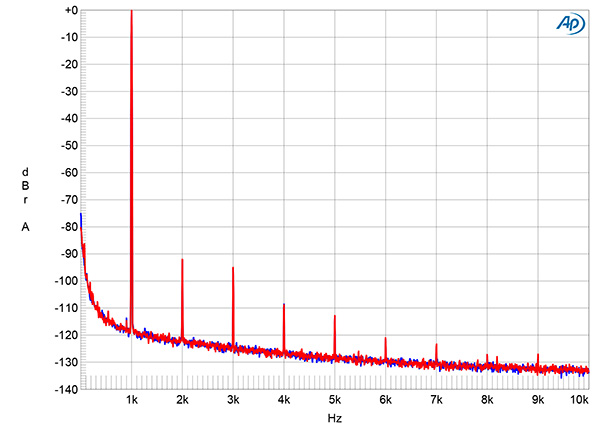
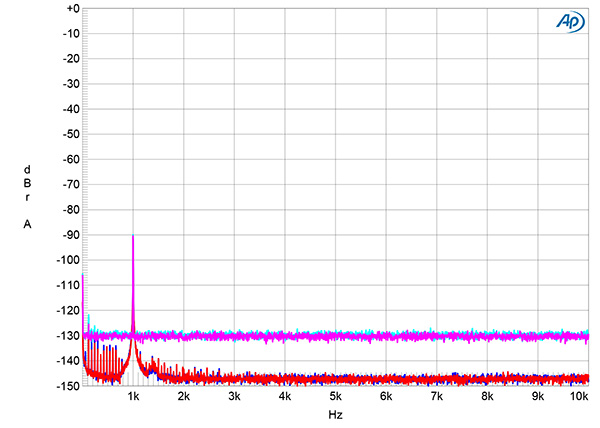
Channel separation below 2kHz was good, at >80dB in both directions, but decreased to 63dB at 20kHz due to the usual capacitive coupling between the channels. In Direct mode, with the Stereo 230's line inputs shorted to ground and the volume control set to the maximum, the wideband, unweighted signal/noise ratio (ref. 2.83V into 8 ohms) measured a good 77.2dB in both channels. Restricting the measurement bandwidth to 22kHz increased the ratio to 88.4dB, and an A-weighting filter increased it further, to 91dB. With the tone controls active but set to do nothing, these ratios were all 6dB worse. Spectral analysis of the Leak's low-frequency noisefloor in Direct mode with the volume control set to the maximum (fig.4, blue and red traces) revealed that AC power-line–related spuriae were present, albeit at low levels. Reducing the volume by 20dB and increasing the input level by the same 20dB reduced the levels of the odd-order supply harmonics (green, gray traces). The random noise was 6dB higher with the tone controls active but dropped by 10dB with the volume control set to –20dB.
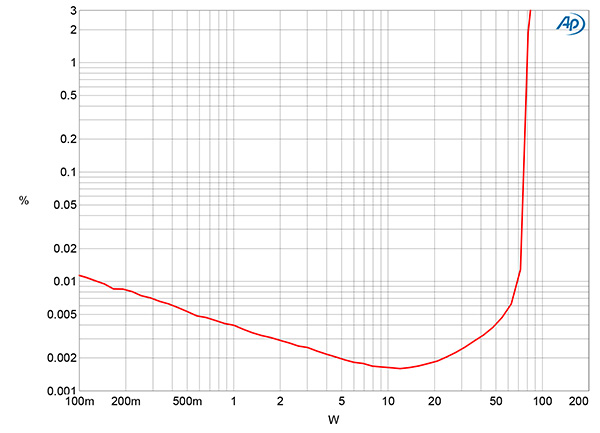
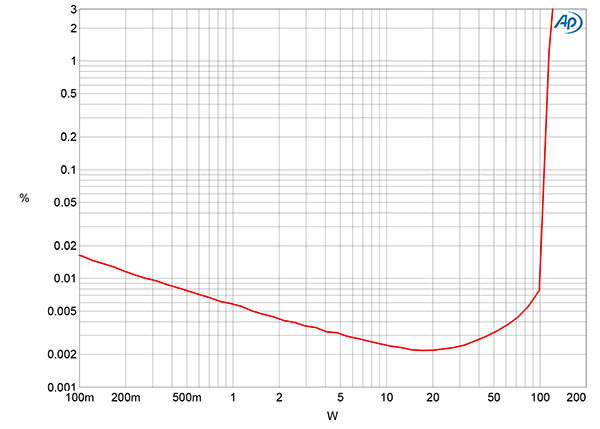
With both channels driven, the Stereo 230 is specified as delivering maximum output powers of 75Wpc into both 8 ohms (18.75dBW) and 115W into 4 ohms (17.6dBW). With our usual definition of clipping as being when the THD+N reaches 1%, the Stereo 230 slightly exceeded the specified powers, clipping at 80Wpc into 8 ohms (19dBW, fig.5) and 120Wpc into 4 ohms (17.8dBW, fig.6).
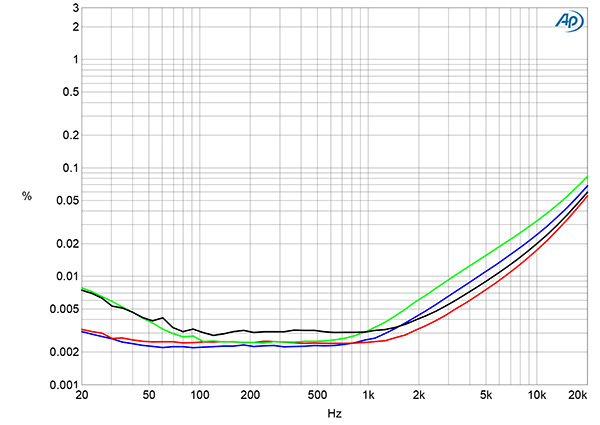
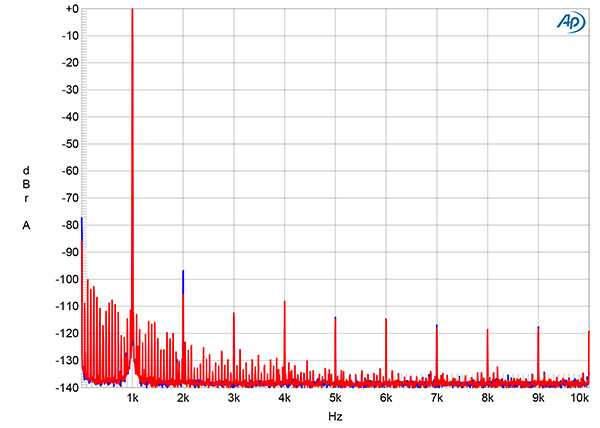
The distortion levels at 12.67V, which is equivalent to 20W into 8 ohms and 40W into 4 ohms (fig.7), were very low. Although the THD rose in the top two audio octaves, it remained below 0.1% (–60dB). The distortion signature appears to be primarily second-harmonic in nature (fig.8), lying at just –97dB (0.0014%, fig.9). Intermodulation distortion was also low (fig.10), the difference product at 1kHz lying at –71dB (0.03%) and the higher-order products at 18kHz and 21kHz at –80dB (0.01%).
Turning to the Stereo 230's MM-compatible phono input, I connected a wire between the ground terminal on the amplifier's rear panel and the analyzer's chassis ground, which minimized noise. This input preserved absolute polarity at all of the Leak's outputs. The input impedance, specified as 47k ohms, was 45k ohms at 20Hz and 1kHz, and 39.2k ohms at 20kHz. The maximum gain at 1kHz was 74dB at the speaker outputs, meaning that 1kHz at 5mV results in a signal just below the clipping power. The maximum gain at the preamplifier output was 41.8dB and 51.8dB at the headphone output. To avoid clipping the power amplifier stage, I used the headphone output for the phono input testing, which mutes the speaker outputs.
The phono input's RIAA correction (fig.11) was accurate and well matched between the channels. The wideband, unweighted S/N ratio with the inputs shorted to ground and the volume control set to its maximum was a good 68dB ref. 1kHz at 5mV in both channels. Restricting the measurement bandwidth to the audioband increased this ratio to 71dB, while inserting an A-weighting filter gave a further improvement to 83.4dB. The phono input's noisefloor was commendably free from power supply–related spuriae (fig.12).
The phono input's overload margins, measured with the volume control set to 2 o'clock to avoid clipping the headphone output, were good, at 21dB ref. 1kHz at 5mV from 20Hz to 20kHz. Harmonic distortion via this input was very low; with an input 10dB below the overload point, the second harmonic was the highest in level at just –90dB (0.003%; fig.13). The levels of the intermodulation products with an equal mix of 19 and 20kHz tones were vanishingly low (fig.14).
To examine the performance of the Leak's digital inputs, I used the Audio Precision's optical S/PDIF output, as well as sending test signals to the amplifier via USB from my MacBook Pro. The Stereo 230's S/PDIF input locked to datastreams with sample rates up to 192kHz. Apple's USB Prober app identified the Leak as "LEAK USB Audio 2.0" and revealed that the USB port operated in the optimal isochronous asynchronous mode. Apple's AudioMIDI utility showed that the Stereo 230 accepted 24- and 32-bit integer data sampled at all rates from 44.1kHz to 768kHz via USB.
With the volume control set to its maximum, a 1kHz digital signal at –20dBFS resulted in an output level of 9.81V into 8 ohms from the loudspeaker output, which is 8.2dB below the clipping voltage into this load. The Leak has 12dB too much gain for its digital inputs. The level at the preamp output with this signal was 240.7mV; that from the headphone output was 762.1mV. I used the headphone output for the digital input testing. With the volume control at its maximum, data at 0dBFS clipped the headphone output. I reduced the volume so that the level with 0dBFS data was 5V, well below clipping.
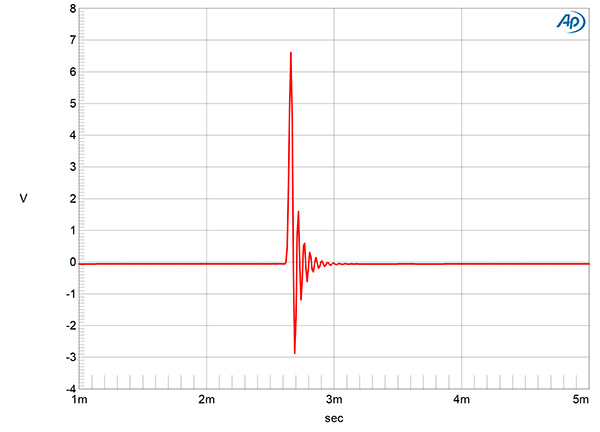
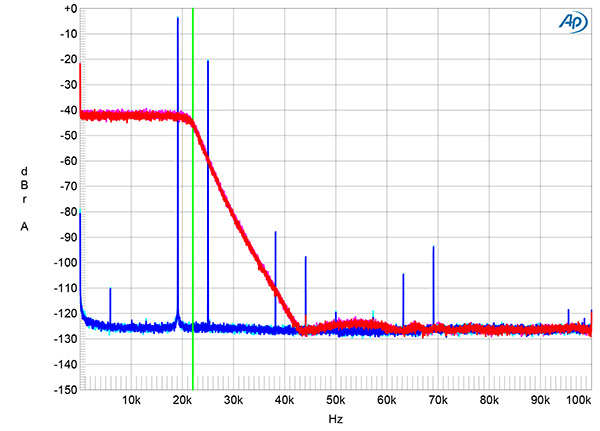
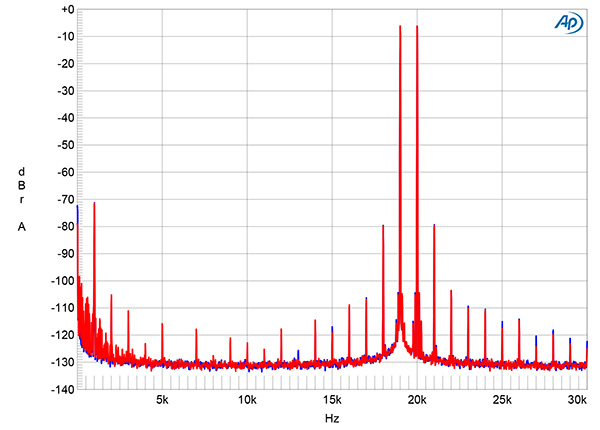
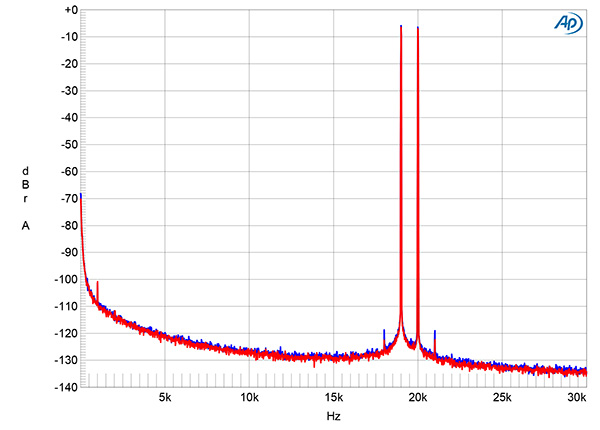
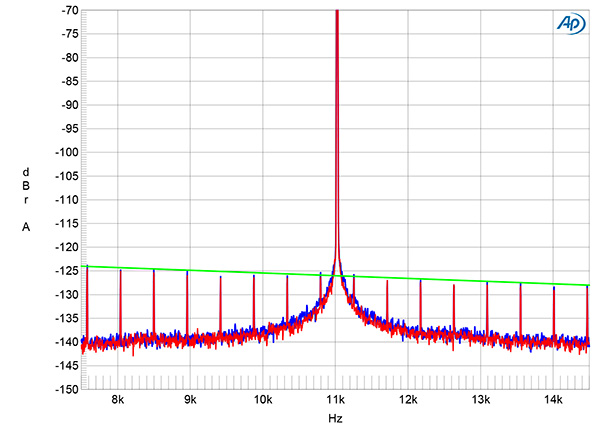
There is just one reconstruction filter; its impulse response with 44.1kHz data (fig.15) revealed that it is a short minimum-phase type, with a small amount of ringing following the single sample at 0dBFS. With 44.1kHz-sampled white noise (fig.16, red and magenta traces), the Stereo 230's digital input response rolled off gently above 20kHz, with the slow rolloff typical of the reconstruction filter used by MQA-enabled DACs for non-MQA data (footnote 1). The aliased image at 25kHz of a 19.1kHz tone at –3dBFS (blue and cyan traces) was attenuated by just 20dB, though the distortion harmonics of the 19.1kHz tone are all very low in level, at or below –90dB (0.003%).
Increasing the bit depth from 16 to 24 with a dithered 1kHz tone at –90dBFS lowered the noisefloor by 18dB (fig.17), meaning that the Stereo 230's digital inputs offer around 19 bits' worth of resolution. With undithered data representing a tone at exactly –90.31dBFS (fig.18), the three DC voltage levels described by the data were well resolved and the waveform was perfectly symmetrical, though overlaid with high-frequency noise.
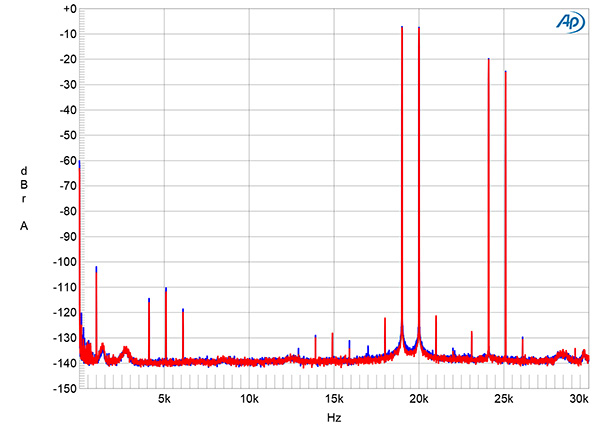
The second-order intermodulation product at 1kHz with an equal mix of 19 and 20kHz tones with a peak level of –3dBFS lay at a very low –103dB (0.0007%, fig.19). As expected from fig.14, the aliased products at 24.1kHz and 25.1kHz are relatively high in level.
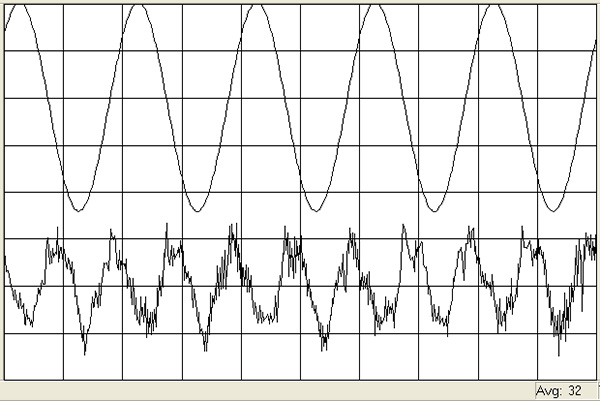
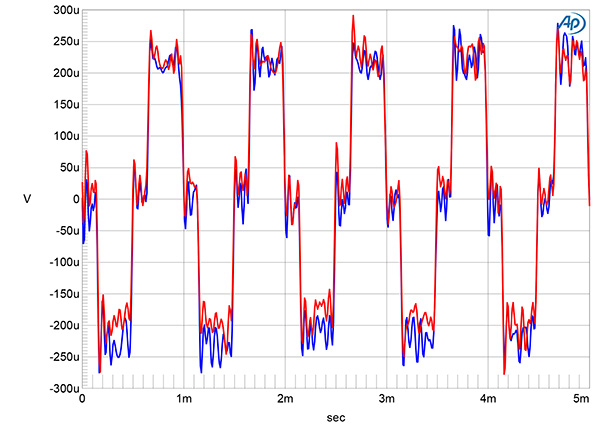
The Leak's rejection of word-clock jitter with 16-bit data was identical with USB and S/PDIF data. While all the odd-order harmonics of the LSB-level, low-frequency squarewave were at the correct levels, indicated by the sloping green line in fig.20, the spectral spike that represents the high-level tone at one-quarter the sample rate is broadened at its base, this due to low-frequency random-noise jitter.
The Leak Stereo 230 amplifier offers excellent measured performance from all of its inputs.—John Atkinson
Footnote 1: See, for example, fig.2 here.


