Sidebar 3: Measurements
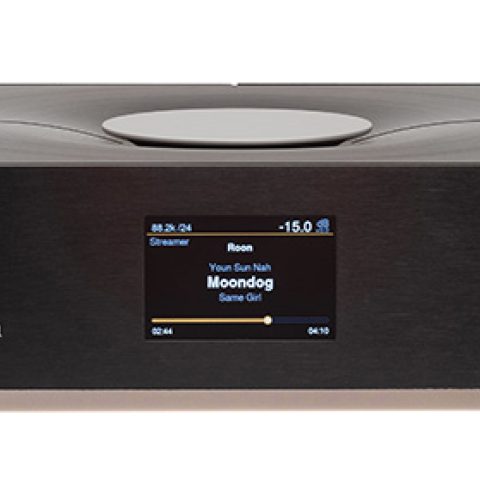
The Grimm MU2 adds analog outputs and inputs to the Roon Ready MU1 streamer that I very favorably reviewed in March 2021. I measured the MU2 with my Audio Precision SYS2722 system, repeating some of the tests with the higher-resolution Audio Precision APx555 system. The review sample was fitted with the v0.9.6 firmware, and while the wheel on the top panel allows access to the settings menu as well as volume and input selection, I preferred to use the MU2's webpage. Once the Grimm is connected to the user's network, this page can be found by scanning the QR code shown on the front panel's menu display.
Looking first at the performance as a D/A processor using test files streamed with Roon as well as optical and coaxial S/PDIF data—the TosLink input was restricted to sample rates of 96kHz and below—the MU2 preserved absolute polarity (ie, was noninverting) from its balanced, single-ended, and headphone outputs. The volume control operated in accurate 1dB steps. With the control set to "+0.0," the output level with a 1kHz signal at 0dBFS was 3.05V from all the analog outputs. Increasing the volume to the maximum of "+8.0" increased the level by 8.16dB, though the outputs clipped with data close to 0dBFS. The line output impedance across the audioband was close to the specified values of 100 ohms balanced and 50 ohms unbalanced, at 94 and 48 ohms, respectively. The headphone jack's output impedance was appropriately very low, at 5 ohms from 20Hz to 20kHz.
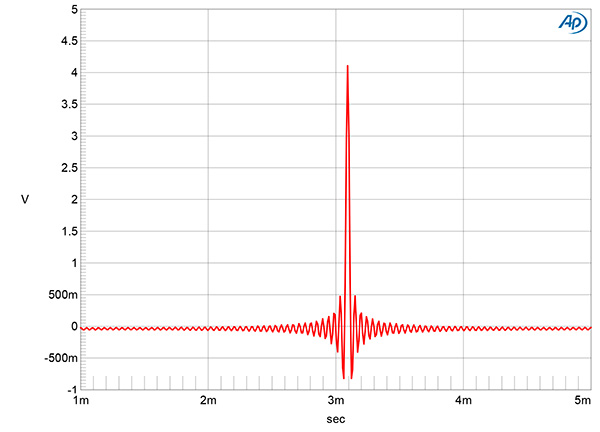
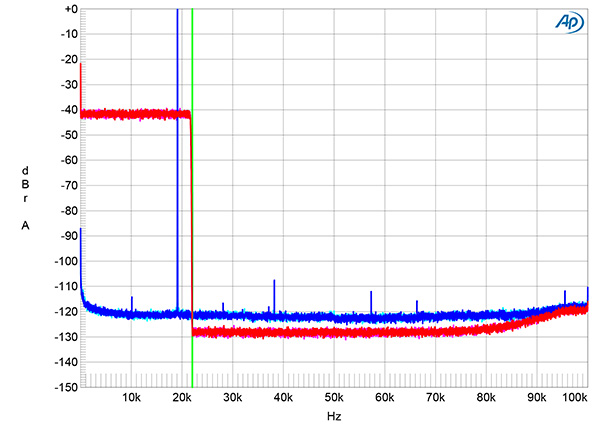
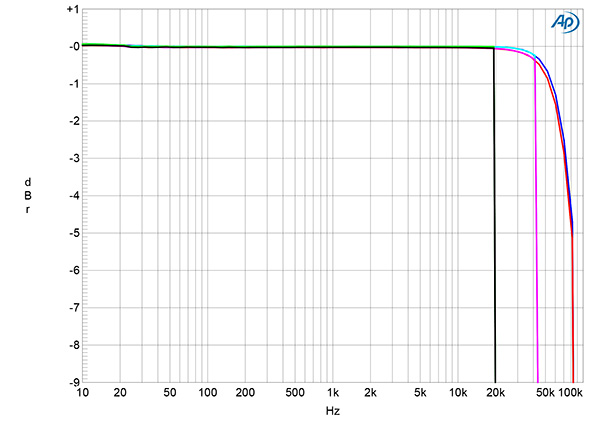
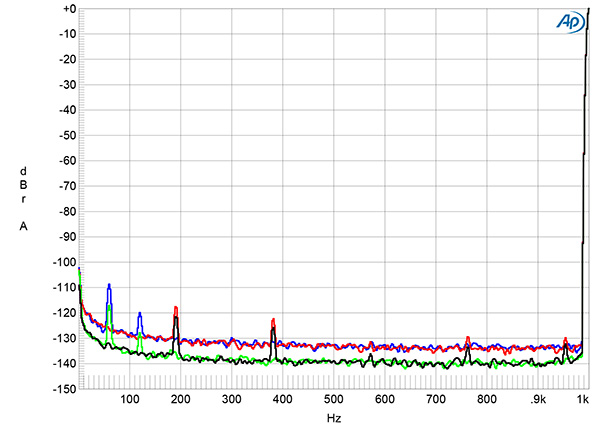
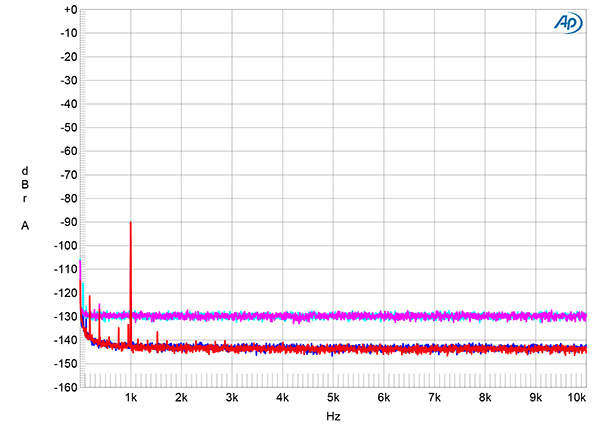
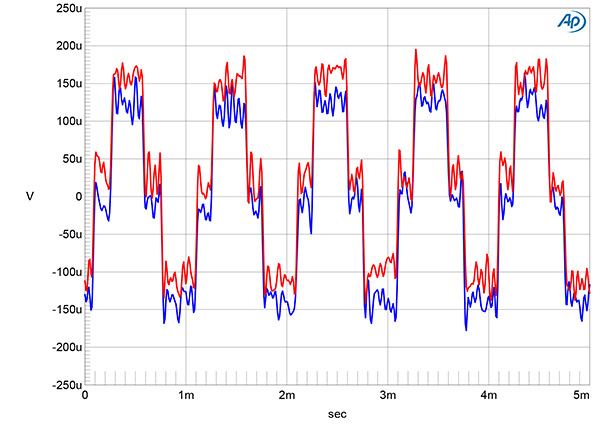
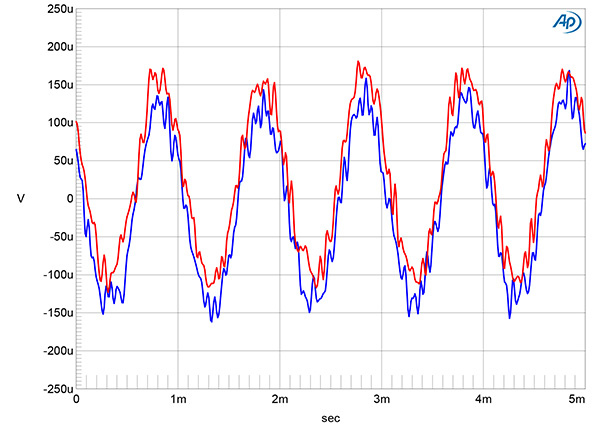
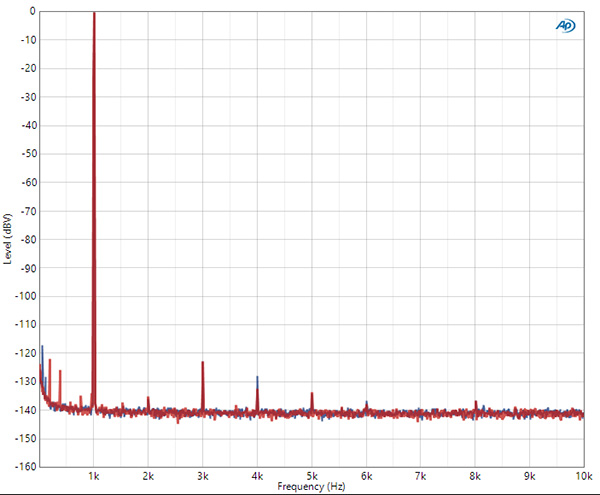
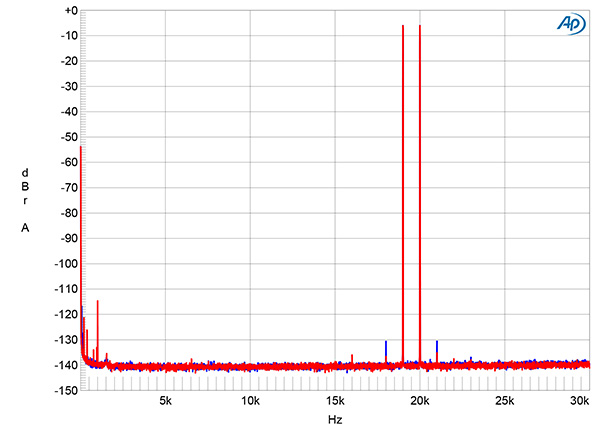
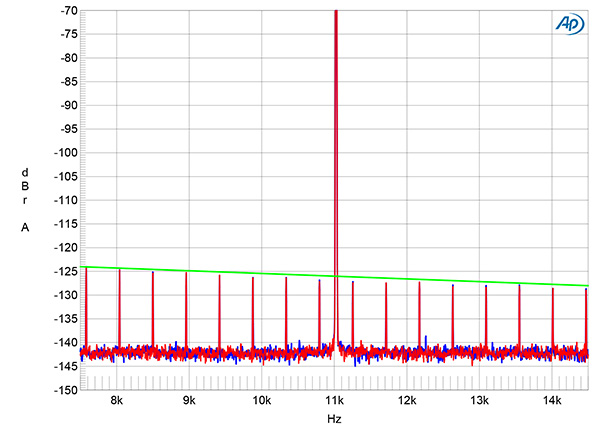
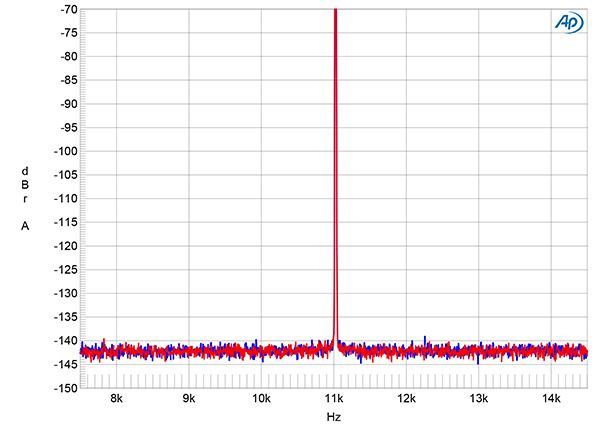
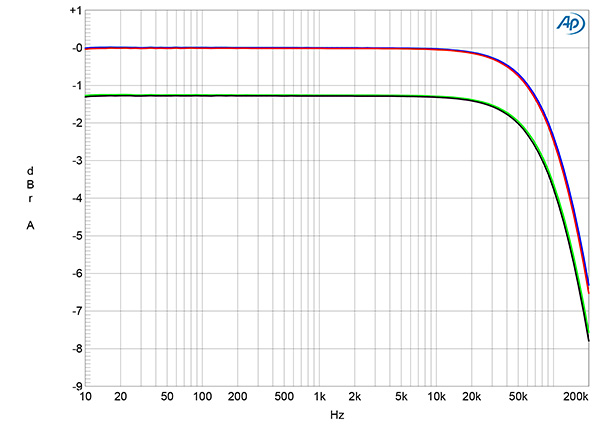
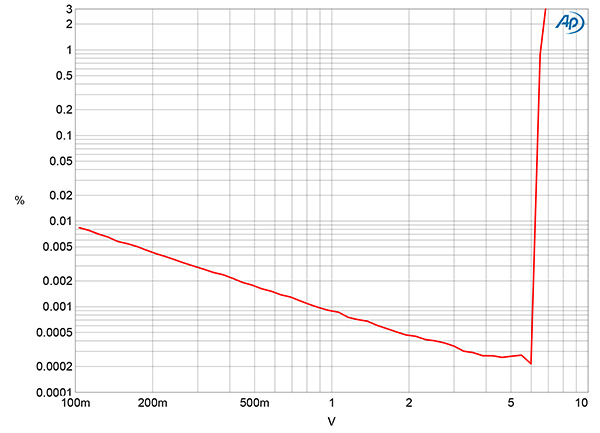
Fig.1 Grimm MU2, impulse response (one sample at 0dBFS, 44.1kHz sampling, 4ms time window).
Fig.2 Grimm MU2, wideband spectrum of white noise at –4dBFS (left channel red, right magenta) and 19.1kHz tone at 0dBFS (left blue, right cyan), with data sampled at 44.1kHz (20dB/vertical div.).
The MU2's impulse response with 44.1kHz data (fig.1) indicates that this filter is a very long linear-phase type, with time-symmetrical ringing on either side of the single full-scale sample. With 44.1kHz-sampled white noise, the MU2's response rolled off extremely quickly above 20kHz (fig.2, red and magenta traces), reaching full stop-band suppression at half the sample rate, indicated by the vertical green line in this graph. There are no aliased images visible of a full-scale tone at 19.1kHz (blue and cyan traces), and the distortion harmonics are all extremely low in level.
Fig.3 Grimm MU2, frequency response at –12dBFS into 100k ohms with data sampled at: 44.1kHz (left channel green, right gray), 96kHz (left cyan, right magenta), and 192kHz (left blue, right red) (1dB/vertical div.).
Fig.4 Grimm MU2, spectrum of 1kHz sinewave, DC–1kHz, at 3V into 100k ohms with volume control set to "+8.0" (left channel blue, right red) and "+0.0" (left green, right gray) (linear frequency scale).
The Grimm's frequency response with data sampled at 44.1, 96, and 192kHz followed the same basic shape, dropping off sharply just below half of each sample rate (fig.3). Channel separation (not shown) ranged from >120dB at low frequencies to a still-excellent 90dB at the top of the audioband. The Grimm offered extremely low noise from all of its outputs. The blue and red traces in fig.4 show the balanced output spectrum at 3V with the volume control set to "+8.0." While power-supply– related spuriae are present at 60Hz and 120Hz in the left channel, along with spuriae of unknown origin at 190Hz and 380Hz in both channels, these are extremely low in level. Reducing the volume to "+0.0" and increasing the input signal by 8dB so that the output level was still 3V reduced the levels of the supply-related spuriae and that of the random noisefloor by 8dB. However, the 190Hz and 380Hz spuriae only dropped by 3dB.
Fig.5 Grimm MU2, spectrum with noise and spuriae of dithered 1kHz tone at –90dBFS with 16-bit data (left channel cyan, right magenta) and 24-bit data (left blue, right red) (20dB/vertical div.).
Fig.6 Grimm MU2, waveform of undithered 1kHz sinewave at –90.31dBFS, 16-bit data (left channel blue, right red).
Fig.7 Grimm MU2, waveform of undithered 1kHz sinewave at –90.31dBFS, 24-bit data (left channel blue, right red).
Fig.5 shows the spectrum of the Grimm's output while it decoded data representing a 1kHz tone at –90dBFS with dithered 16-bit and 24-bit data. (The volume control was set to "+0.0" for this measurement.) The increase in bit depth lowers the noisefloor level by 13dB, which suggests that the MU2's DAC offers noise performance equilvalent to just over 18 bits of resolution. With undithered 16-bit data representing a tone at exactly –90.31dBFS, the three DC voltage levels described by the data were symmetrically reproduced, though overlaid with some noise (fig.6). With undithered 24-bit data, the Grimm output a fairly clean sinewave, despite the very low signal level (fig.7).
Fig.8 Grimm MU2, spectrum of 1kHz, 0dBFS sinewave, DC–10kHz (left channel blue, right red; linear frequency scale).
Fig.9 Grimm MU2, HF intermodulation spectrum, DC–30kHz, 19+20kHz at 0dBFS peak into 600 ohms, sampled at 44.1kHz.
As suggested by fig.2, harmonic distortion was extremely low in level. Fig.8 shows the balanced output spectrum while the MU2 decoded 24-bit data representing 1kHz at 0dBFS. The third harmonic was the highest but lay at a negligible –123dB (0.00007%). Intermodulation distortion with an equal mix of 19kHz and 20kHz tones sampled at 44.1kHz was similarly negligible, even into the demanding 600 ohm load (fig.9).
Fig.10 Grimm MU2, high-resolution jitter spectrum of analog output signal, 11.025kHz at –6dBFS, sampled at 44.1kHz with LSB toggled at 229Hz: 16-bit Toslink data (left channel blue, right red). Center frequency of trace, 11.025kHz; frequency range, ±3.5kHz.
Fig.11 Grimm MU2, high-resolution jitter spectrum of analog output signal, 11.025kHz at –6dBFS, sampled at 44.1kHz with LSB toggled at 229Hz: 24-bit Toslink data (left channel blue, right red). Center frequency of trace, 11.025kHz; frequency range, ±3.5kHz.
The MU2 offered superb rejection of word-clock jitter. Fig.10 was taken with 16-bit optical J-Test data. All the odd-order harmonics of the LSB-level, low-frequency squarewave lay at the correct levels, shown by the sloping green line, there are no supply-related sidebands present, and there is no broadening of the spectral spike at one-quarter the sample rate. Repeating this test with data sourced from Roon gave an identical spectrum, while increasing the word length to 24 bits resulted in a low-level random noisefloor on either side of the narrow central spike (fig.11).
Turning to the performance of the Grimm MU2 as an analog preamplifier, the balanced and unbalanced inputs preserved polarity and with the volume control set to "+0.0," the gain was close to unity from all three types of output, at 0.08dB. The MU2's unbalanced input impedance is specified as 50k ohms; I measured 45k ohms at 20Hz and 1kHz, 32k ohms at 20kHz. The balanced input impedance was fairly close to the specified 100k ohms, at 90k ohms at low and middle frequencies, dropping to a still-high 73k ohms at the top of the audioband.
Fig.12 Grimm MU2, balanced input/output, frequency response at 1V with volume control set to "+8.0" into 100k ohms (left channel blue, right red) and 600 ohms (left green, right gray) (1dB/vertical div.).
The analog inputs' frequency response, taken with the volume control set to its maximum, was flat from 10Hz to 20kHz and down by 3dB at 120kHz (fig.12). The very close channel matching was retained at lower settings of the control. The wideband, unweighted signal/noise ratio, measured at the balanced outputs with the unbalanced input shorted to ground and the volume control set to "+8.0," was a superb 91dB ref. 3V. Restricting the measurement bandwidth to the audioband increased this ratio by 20dB, while switching an A-weighting filter into circuit further improved the ratio to 112dB. Reducing the volume control to the unity-gain setting improved the S/N ratios by 6dB.
Fig.13 Grimm MU2, balanced input/output, THD+N (%) vs 1kHz output voltage into 100k ohms.
As with the digital inputs, both harmonic and intermodulation distortion were extremely low in level with the analog inputs. Fig.13 plots the percentage of THD+noise in the Grimm's balanced output against the output voltage into 100k ohms. Actual distortion lies beneath the noisefloor below the voltage when the waveform starts to clip. The THD+N reached 1% at 6.6V with both the balanced and unbalanced outputs. The clipping voltages into 600 ohms were 5.3V, balanced, and 5.6V, unbalanced.
Although its noise performance is not up there with that of the best-measuring D/A processors, the Grimm MU2's measured performance is otherwise simply superb.—John Atkinson