I used DRA Labs' MLSSA system, a calibrated DPA 4006 microphone, and an Earthworks microphone preamplifier to measure the GoldenEar T66's quasi-anechoic frequency- and time-domain behavior in the farfield. I raised the speaker on a dolly and a stack of 2 × 4s so that the tweeter was midway between the floor and ceiling. Because of the geometry of my listening room, where I performed the measurements, the microphone distance was 1m rather than my usual 50". I used an Earthworks QTC-40 microphone for the nearfield responses and Dayton Audio's DATS V2 system to examine the loudspeaker's impedance magnitude and phase. All the measurements were taken with the grille in place.
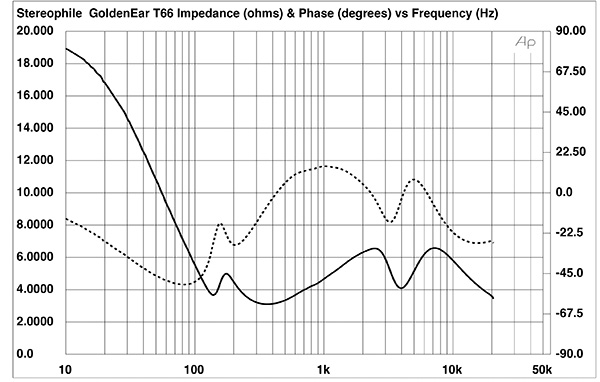
GoldenEar specifies the T66's sensitivity as a high 91dB/2.83V/m. My B-weighted estimate, measured on the tweeter axis, was within experimental error of that value, at 91.3dB(B)/2.83V/m. The T66's nominal impedance is specified as 4 ohms. The impedance magnitude (fig.1, solid trace) appears to average 4 ohms through the audioband but rises considerably below 100Hz due to the passive high-pass filter that crosses the upper-frequency drive units to the powered subwoofers. The minimum impedance was 3.1 ohms at 362kHz. The electrical phase angle (fig.1, dotted trace) is occasionally high, which means that the effective resistance, or EPDR (footnote 1), drops below 3 ohms between 57Hz and 1180Hz and above 9.7kHz. The minimum EPDR values are 1.4 ohms at 124Hz, 1.67 ohms at 248Hz, 2.48 ohms at 591Hz, and 1.6 ohms at 20kHz. The T66 is a demanding load for the partnering amplifier, though this will be ameliorated by the high voltage sensitivity.
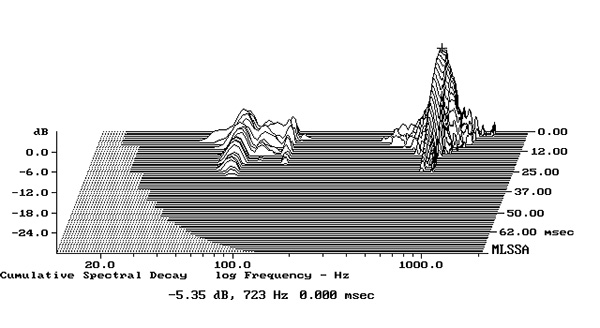
The impedance traces are free from the small discontinuities that would imply the presence of cabinet resonances. However, when I investigated the enclosure's resonant modes with a plastic-tape accelerometer, I found a high-level mode at 723Hz on the sidewalls level with the tweeter (fig.2). The affected area was small, and given both the high Q (Quality Factor) and frequency, it is unlikely that this behavior will add audible coloration.
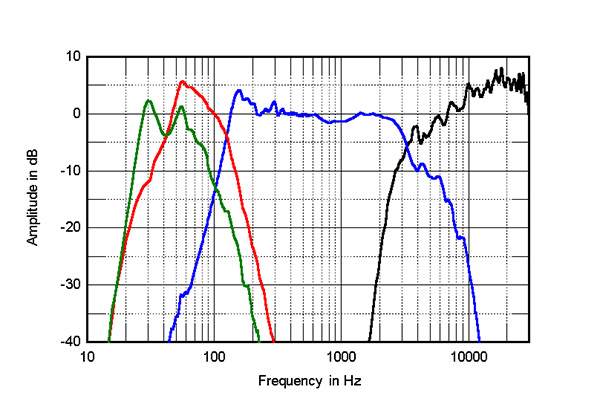
The small peak centered on 176Hz in the impedance magnitude trace suggests that this is the sealed-box tuning frequency of the two midrange/bass drive units. The blue trace in fig.3 shows the response of these drivers measured in the nearfield; it peaks a little at the tuning frequency before rapidly rolling off. Its output crosses over to that of the two powered subwoofers (red trace) at 128Hz, though this will vary with the settings of the subwoofer level control. The subwoofers' nearfield output peaks between 50Hz and 100Hz and rolls off rapidly above and below that region. The small discontinuity in their output just below 30Hz indicates that this is the tuning frequency of the two passive radiators, which confirms GoldenEar's specified low-frequency extension for the T66 of –6dB at 29Hz.
Because of the passive radiators' large surface area and correspondingly small motion, with the other GoldenEar speakers I measured the output of these radiators with an accelerometer taped to the diaphragms to minimize crosstalk from the active drive units (footnote 2). Unfortunately, even following instructions from GoldenEar's Martyn Miller, I wasn't able to remove the grilles that cover the passive radiators. (I tried attaching the accelerometer to the grille, but the result was anomalous, perhaps due to the grille's own vibrational behavior.) The green trace in fig.3 therefore shows the output of the two passive radiators measured in the nearfield with a microphone. The primary peak in their response lies at a low 30Hz, with a rapid rolloff below that frequency. The second peak between 50Hz and 60Hz is due to the measurement being corrupted by crosstalk.
Higher in frequency in fig.3, the output of the T66's mid/bass units is respectably even up to the crossover to the AMT tweeter, which lies just above 3kHz. The tweeter's output continues to rise above the crossover frequency, and its output in the top audio octave peaks by 5dB, as explained by Garth Powell in my interview. Note the small peaks and dips in its response; this behavior will be due to reflections of the tweeter's output from the open-mesh grille but will not have audible consequences.
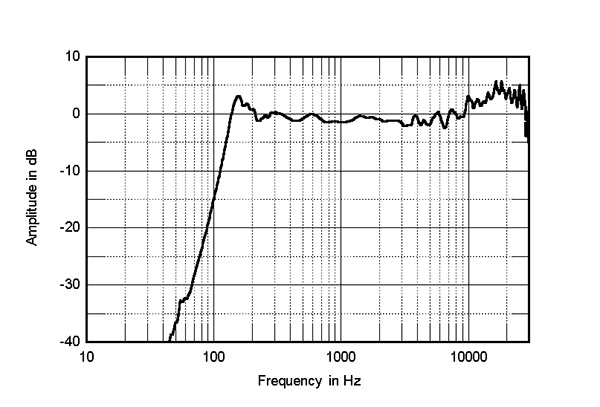
The T66's farfield response, averaged across a 30° horizontal window centered on the tweeter axis, is shown as the trace above 310Hz in fig.4. (The trace below 310Hz repeats the nearfield response of the mid/bass units; I didn't calculate the overall low-frequency behavior with the powered subwoofers and radiators because of the unavoidable crosstalk mentioned earlier; footnote 3.) The response is even other than the small peaks and dips due to the grille reflections. The pair matching between the two samples was excellent, the difference in their farfield responses falling within ±0.25dB limits from 1kHz to 30kHz.
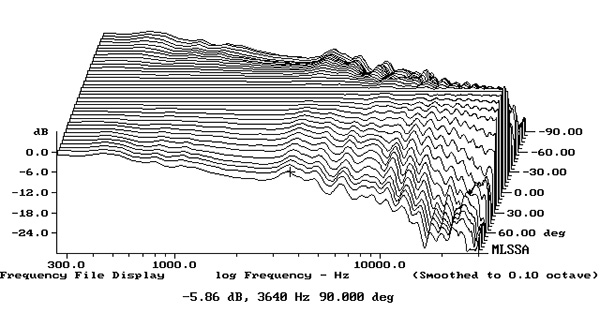
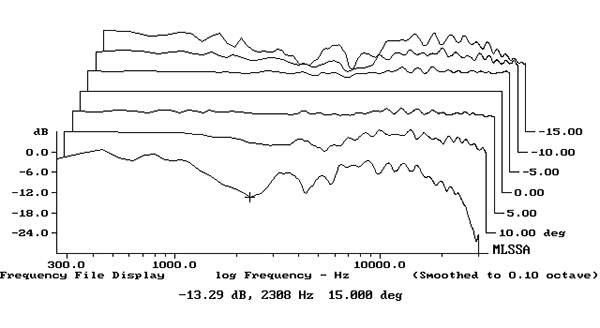
The T66's horizontal radiation pattern is shown in fig.5, normalized to the response on the tweeter axis, which therefore appears as a straight line. The dispersion is well controlled in the midrange and treble up to 10kHz, above which the tweeter's dispersion narrows. The even spacing of the contour lines below 10kHz will correlate with stable, accurate stereo imaging. Fig.6 shows the T66's dispersion in the vertical plane, again normalized to the response on the tweeter axis. The response doesn't vary significantly between 10° above and below the tweeter axis, which is good considering that the tweeter is a high 41" from the floor.
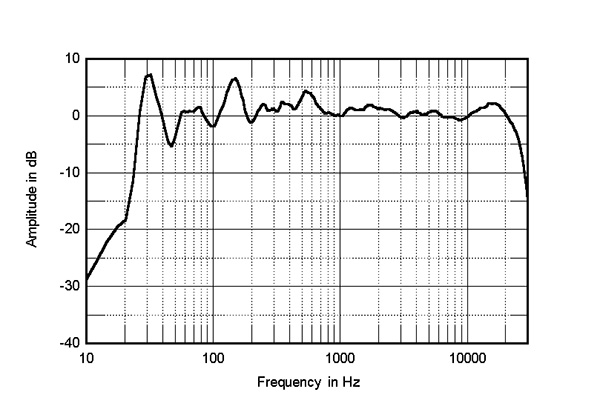
Fig.7 shows the spatially averaged response (footnote 4) of the GoldenEar T66s in my room. The level controls of their powered subwoofers were set to the central, 12:00 position. The GoldenEars maximally excite my room's lowest-frequency mode, but other than a small peak at the mid/bass units' tuning frequency and a slight excess of midrange energy, the in-room response is even from the midbass region through to 10kHz. As expected from fig.4, there is too much energy in the top audio octave, in place of the usual gentle slope down, that will primarily be due to the increased absorption of the room's furnishings as the frequency increases.
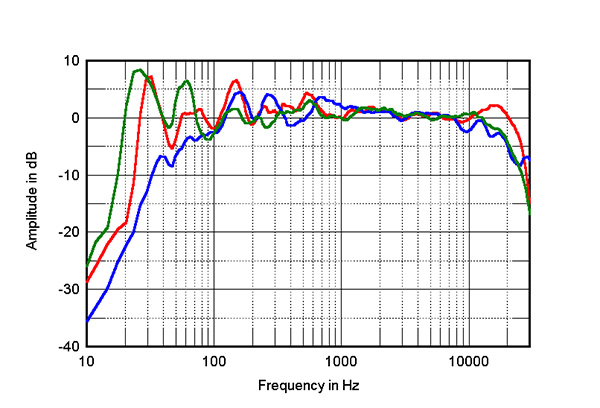
The red trace in fig.8 repeats the T66s' spatially averaged response and compares it with that of the GoldenEar BRX (blue trace) and Triton Reference (green) in my room. The two earlier GoldenEar speakers have the sloped-down response above 10kHz, but the treble behavior of all three speaker types is otherwise very similar. (I didn't measure the spatially averaged in-room response of the GoldenEar Triton One.R,but the quasi-anechoic measurement showed similar high-frequency behavior to that of the T66; footnote 5.) The T66s' low frequencies are better behaved than those of the Triton References. The bass of the standmount BRXes' bass is shelved down compared with that of the two floorstanders; as I have mentioned in other reviews, I use Roon's DSP parametric equalizer to flatten and extend this speaker's low-frequencies in-room.
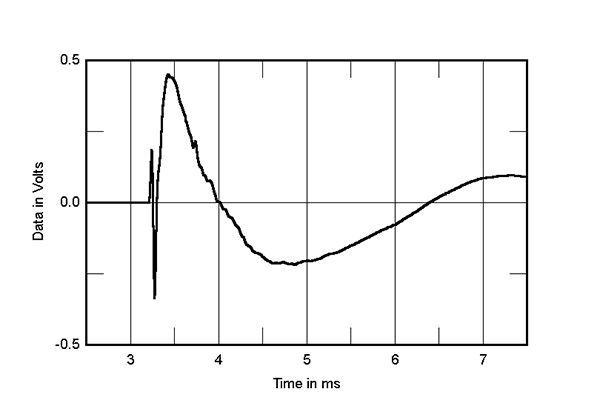
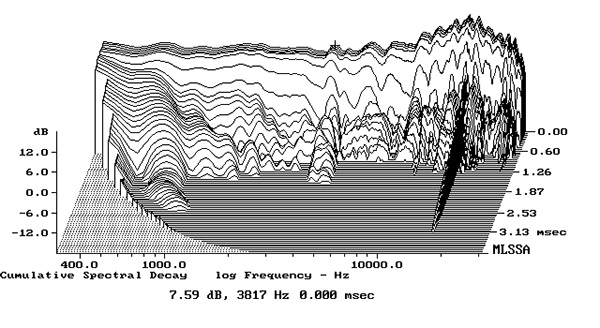
In the time domain, the GoldenEar speaker's step response (fig.9), taken with the subwoofers powered down, indicates that the tweeter and mid/woofers are all connected in positive acoustic polarity. The tweeter's output arrives first at the microphone, and the decay of its step cleanly merges with the positive-going start of the mid/bass units' step, which indicates an optimal crossover topology. Other than a low-level mode at 3.8kHz and ripples due to the reflections of the tweeter's output from the grille, theT66's cumulative spectral-decay (aka waterfall) plot (fig.10) is superbly clean.
Overall, other than its elevated top octave, the GoldenEar T66 offers excellent measured performance.—John Atkinson
Footnote 1: EPDR is the resistive load that gives rise to the same peak dissipation in an amplifier's output devices as the loudspeaker. See "Audio Power Amplifiers for Loudspeaker Loads," JAES, Vol.42 No.9, September 1994, and stereophile.com/reference/707heavy/index.html.
Footnote 2: See, for example, stereophile.com/content/goldenear-brx-bookshelf-reference-x-loudspeaker-measurements.
Footnote 3: But see Paul Miller's low-frequency response measurement for Stereophile's sister magazine Hi-Fi News here.
Footnote 4: I average 20 1/6-octave–smoothed spectra, taken for the left and right speakers individually using a 96kHz sample rate, in a vertical rectangular grid 36" wide by 18" high and centered on the positions of my ears. This tends to smooth out the peaks and dips below 400Hz that are due to the room's resonant modes.


