| Columns Retired Columns & Blogs |
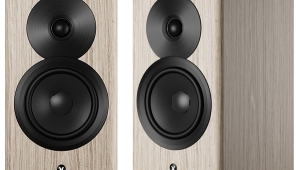
Dynaudio Focus 140 loudspeaker Measurements
Sidebar 3: Measurements
All the measurements were performed with the speaker's reflex port open. The Dynaudio Focus 140's estimated voltage sensitivity was 86.1dB(B)/2.83V/m, which is slightly below the average of the speakers Stereophile has reviewed, but within the margin of error of the specified 86dB figure. Its impedance dropped to 4 ohms at 170Hz (fig.1) but remained above 6 ohms for much of the midrange and treble, with a moderate electrical phase angle. The speaker will not be demanding when it comes to choosing an amplifier with which to partner it.
The traces in fig.1 are free from the small wrinkles that would indicate the presence of cabinet-panel resonances. A cumulative spectral-decay plot (fig.2), calculated from the output of a piezoelectric accelerometer fastened to the center of the top panel, uncovered just a couple of low-level resonant modes, though some overall motion centered on the port tuning frequency can be seen.
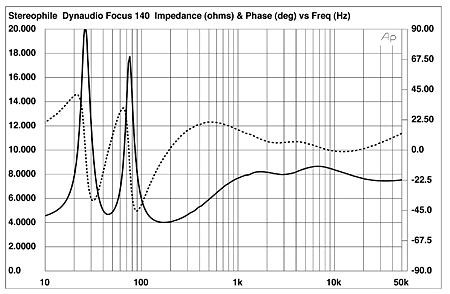
Fig.1 Dynaudio Focus 140, electrical impedance (solid) and phase (dashed). (2 ohms/vertical div.)
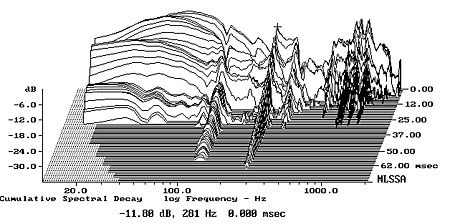
Fig.2 Dynaudio Focus 140, cumulative spectral-decay plot calculated from the output of an accelerometer fastened to the cabinet's top panel (MLS driving voltage to speaker, 7.55V; measurement bandwidth, 2kHz).
The saddle centered on 46Hz in the impedance-magnitude trace in fig.1 suggests that this is the tuning frequency of the flared port on the rear panel, in turn implying only modest bass extension. The nearfield output of the port is shown as the red trace in fig.3. It peaks between 30Hz and 80Hz (–3dB frequencies) and its midrange output is free from resonant garbage. The minimum-motion notch in the woofer's response (blue trace) occurs at the port tuning frequency of 46Hz, as expected. The complex sum of the nearfield woofer and port outputs, taking into account both acoustic phase and the distances of the two radiators from a nominal farfield microphone position, is shown as the black trace below 300Hz in fig.3. Most of the upper-bass rise is an artifact of the nearfield measurement technique; the Focus 140 is pretty much maximally flat down to 60Hz, with then a fourth-order, 24dB/octave rollout.
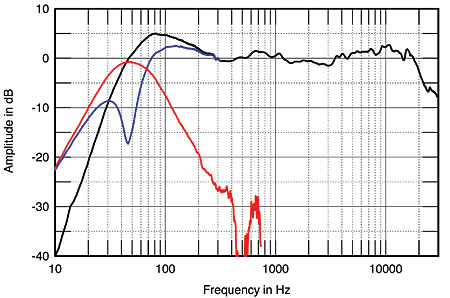
Fig.3 Dynaudio Focus 140, anechoic response on tweeter axis at 50", averaged across 30° horizontal window and corrected for microphone response, with the nearfield responses of the woofer (blue), port (red), and their complex sum (black).
Higher in frequency in fig.3, the Dynaudio's response on its tweeter axis is impressively flat overall, though with a slight swayback in the presence region. All things being equal, this might tend to make the Focus 140 sound very slightly polite. However, the speaker's horizontal radiation pattern (fig.4) reveals that it compensates for a slight off-axis flare in the same region. The Dynaudio will sound neutral in the mid-treble in rooms of normal size and absorptivity. Similarly in the top octave, the slight excess of energy seen in fig.3 will tend to balance the tweeter's limited dispersion in the same region in all but very large, dead rooms.
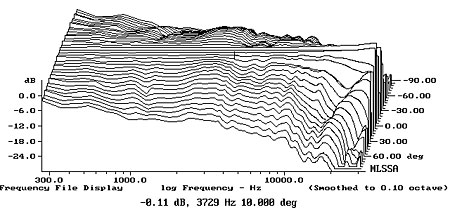
Fig.4 Dynaudio Focus 140, lateral response family at 50", normalized to response on tweeter axis, from back to front: differences in response 90–5° off axis, reference response, differences in response 5–90° off axis.
In the vertical plane (fig.5), significant suckouts develop in the crossover region more than 10° above or below the tweeter axis. The Focus 140 should be used on stands that place the listener pretty much on the tweeter axis.
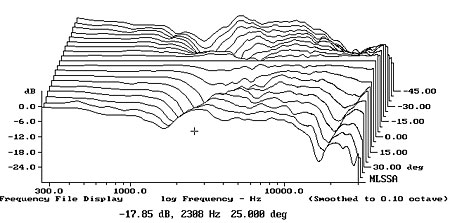
Fig.5 Dynaudio Focus 140, vertical response family at 50", normalized to response on tweeter axis, from back to front: differences in response 45–5° above axis, reference response, differences in response 5–45° below axis.
In the time domain, the Dynaudio's step response (fig.6) indicates that both drive-units are connected with the same, positive, acoustic polarity. The smooth handover from the short tweeter step to the lazier woofer step correlates with the excellent frequency-domain integration seen between the drive-units in fig.3. The farfield cumulative spectral-decay plot (fig.7) is superbly clean in both the upper midrange and the treble.
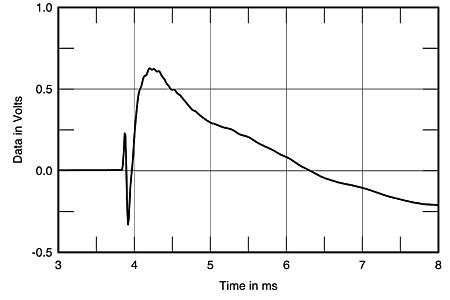
Fig.6 Dynaudio Focus 140, step response on tweeter axis at 50" (5ms time window, 30kHz bandwidth).
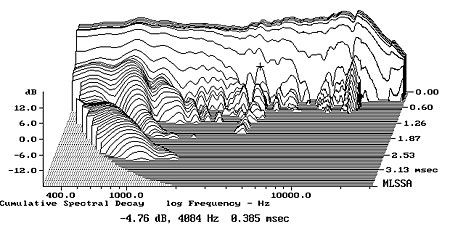
Fig.7 Dynaudio Focus 140, cumulative spectral-decay plot at 50" (0.15ms risetime).
Despite its fairly low price, Dynaudio's Focus 140 offers excellent measured performance.— John Atkinson
- Log in or register to post comments
