Sidebar 3: Measurements
I measured a Dynaudio Contour 30i loudspeaker with serial number 10154186. I used DRA Labs' MLSSA system, a calibrated DPA 4006 microphone, and an Earthworks microphone preamplifier to measure the quasi-anechoic frequency- and time-domain behavior in the farfield. I used an Earthworks QTC-40 microphone for the nearfield responses and Dayton Audio's DATS V2 system to measure the impedance magnitude and phase.
Footnote 1: EPDR is the resistive load that gives rise to the same peak dissipation in an amplifier's output devices as the loudspeaker. See "Audio Power Amplifiers for Loudspeaker Loads," JAES, Vol.42 No.9, September 1994, and stereophile.com/reference/707heavy/index.html. Footnote 2: A nearfield measurement assumes that the baffle extends to infinity in both horizontal and vertical planes. See the discussion here.
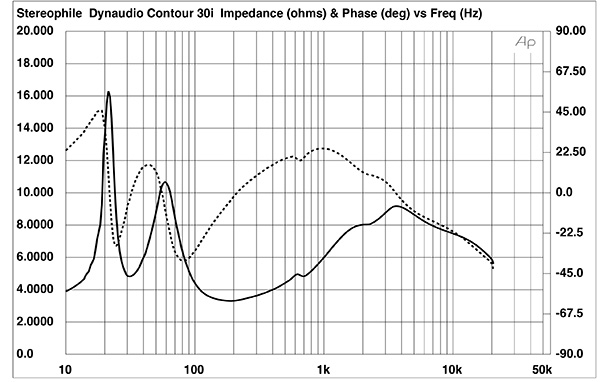
Fig.1 Dynaudio Contour 30i, electrical impedance (solid) and phase (dashed) (2 ohms/vertical div.).
Dynaudio specifies the Contour 30i's voltage sensitivity as 87dB/2.83V/m. My B-weighted estimate, measured on the tweeter axis without the grille, was slightly higher, at 87.8dB(B)/2.83V/m. The Contour 30i's nominal impedance is specified as 4 ohms. The impedance magnitude (fig.1, solid trace) was close to 4 ohms between 100Hz and 400Hz and ranged between 6 ohms and 9 ohms in the treble. The minimum impedance was 3.3 ohms at 190Hz. The electrical phase angle (fig.1, dotted trace) is occasionally high, which means that the effective resistance, or EPDR (footnote 1), drops below 3 ohms from 72Hz to 1100Hz and above 13.8kHz. The minimum EPDR values are 1.73 ohms at 107Hz and 2.3 ohms at 443Hz. The Contour 30i is a relatively demanding load for the partnering amplifier.
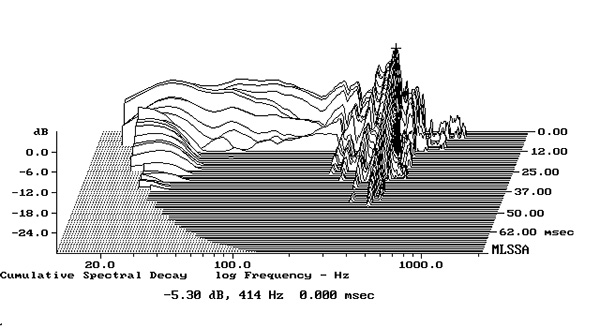
Fig.2 Dynaudio Contour 30i, cumulative spectral-decay plot calculated from output of accelerometer fastened to the center of the sidewall level with the lower port (MLS driving voltage to speaker, 7.55V; measurement bandwidth, 2kHz).
There is a slight discontinuity in the impedance traces between 500Hz and 600Hz, which might be due to a resonance of some kind. The enclosure's sidewalls did seem lively when I rapped them with my knuckles. Using a plastic-tape accelerometer, I found a resonant mode at 414Hz on the center of each sidewall level with the lower port (fig.2) and another mode at 383Hz on the walls level with the upper woofer. These modes are below the frequency of the impedance discontinuity but are relatively high in level. However, they have a high Q (Quality Factor), which will work against any audible consequences.
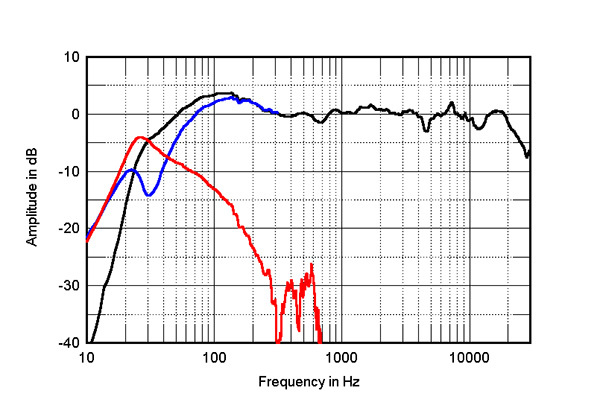
Fig.3 Dynaudio Contour 30i, anechoic response on tweeter axis at 50", averaged across 30° horizontal window and corrected for microphone response, with the nearfield responses of the woofers (blue), ports (red), and the complex sum of the nearfield responses (black), respectively plotted below 300Hz, 700Hz, and 300Hz.
The saddle centered on 31Hz in the impedance magnitude trace suggests that this is the tuning frequency of the two ports mounted on the Dynaudio's rear panel. (With the ports blocked with the supplied foam plugs, there was a single impedance peak at 52Hz, which will be the sealed-box tuning frequency.) The blue trace below 300Hz in fig.3 shows the sum of the woofers' responses measured in the nearfield; it has the expected notch at the reflex tuning frequency. The sum of the ports' nearfield responses (fig.3, red trace) peaks just below the tuning frequency before rolling off cleanly at higher frequencies.
The complex sum of the woofers' and ports' nearfield responses is shown as the black trace below 300Hz in fig.3. The peak in the upper bass, which will be due to the nearfield measurement technique (footnote 2), is not as high as usual, which suggests that the Contour 30i's reflex alignment is somewhat overdamped, favoring articulation over maximum low-frequency weight.
Higher in frequency in fig.3, the black trace shows the Contour 30i's farfield response, averaged across a 30° horizontal window centered on the tweeter axis. It is impressively even through the midrange and treble, with three small suckouts balanced by a couple of small peaks. The tweeter's output rolls off above 20kHz. This graph was taken without the vestigial grille. Repeating the response measurement with the grille made little difference other than reducing the average treble level by a dB or so.
Fig.4 Dynaudio Contour 30i, lateral response family at 50", normalized to response on tweeter axis, from back to front: differences in response 90–5° off axis, reference response, differences in response 5–90° off axis.
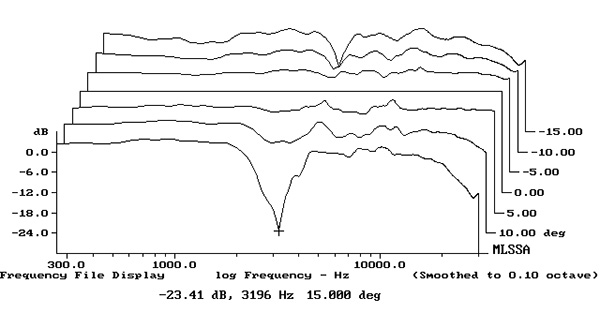
Fig.5 Dynaudio Contour 30i, vertical response family at 50", normalized to response on tweeter axis, from back to front: differences in response 15–5° above axis, reference response, differences in response 5–15° below axis.
The speaker's horizontal radiation pattern, normalized to the response on the tweeter axis, which therefore appears as a straight line, is shown in fig.4. The dispersion is very well controlled, with the contour lines in this graph evenly spaced throughout the midrange and mid-treble region. This will correlate with accurate, stable stereo imaging. As usual with a 28mm dome tweeter, the radiation pattern narrows in the top octave. Fig.5 shows the Contour 30i's dispersion in the vertical plane, again normalized to the response on the tweeter axis, which is 42" from the floor. The dispersion is relatively uniform up to 10° above and below that axis, with a suckout at 3.2kHz appearing at greater off-axis angles. I assumed that this was the crossover frequency between the upper woofer and the tweeter, but the Contour 30i's specifications state that this lies at 2.2kHz.
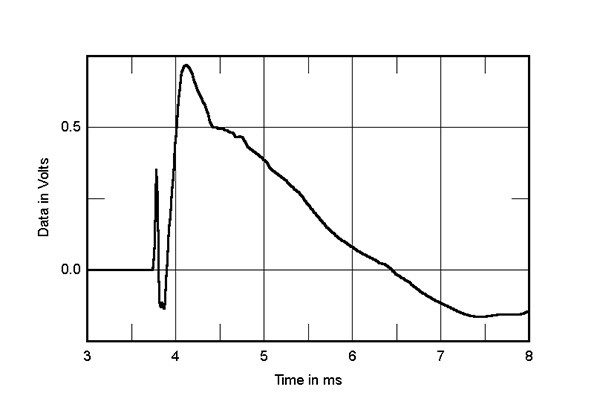
Fig.6 Dynaudio Contour 30i, step response on tweeter axis at 50" (5ms time window, 30kHz bandwidth).
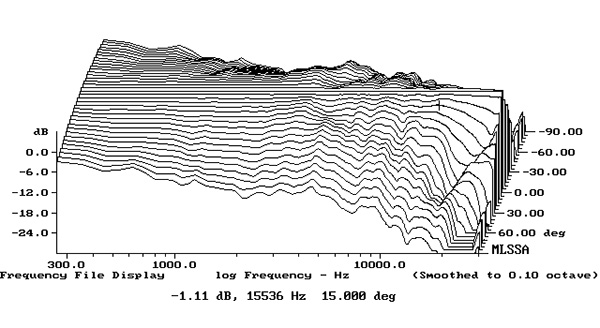
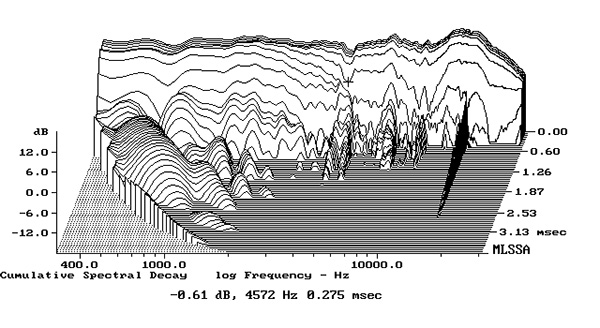
Fig.7 Dynaudio Contour 30i, cumulative spectral-decay plot on tweeter axis at 50" (0.15ms risetime).
Turning to the time domain, the Dynaudio's step response on the tweeter axis (fig.6) indicates that all three drive units are connected in positive acoustic polarity. This puzzled me, as Dynaudio's specifications say that the Contour 30i's crossover is second-order. Usually with that topology, the drive units need to be connected in opposite polarity to give the optimal blend of their outputs in the crossover region, but fig.3 indicates that the Contour 30i doesn't have a problem in that region. The tweeter's output arrives first at the microphone followed by that of the upper woofer with the decay of its step overlaid by the lower woofer's output. The Contour 30i's cumulative spectral-decay (waterfall) plot (fig.7) is superbly clean. (Ignore the ridge of delayed energy close to 16kHz, which is due to interference from the measurement computer's video circuitry.)
The most recent model in Dynaudio's Contour series that Stereophile reviewed was the Contour 20 two-way standmount in April 2017. The Contour 30i's measured performance rivals that of the Contour 20. I can only repeat what I wrote in the measurements section of Herb Reichert's review: "Overall, the Dynaudio Contour 20's measured performance indicates excellent audio engineering, as I have come to expect from Dynaudio." Ditto for the Contour 30i.—John Atkinson
Footnote 1: EPDR is the resistive load that gives rise to the same peak dissipation in an amplifier's output devices as the loudspeaker. See "Audio Power Amplifiers for Loudspeaker Loads," JAES, Vol.42 No.9, September 1994, and stereophile.com/reference/707heavy/index.html. Footnote 2: A nearfield measurement assumes that the baffle extends to infinity in both horizontal and vertical planes. See the discussion here.


