After performing the CH Precision L10 balanced input's Calibration procedure, I used my Audio Precision SYS2722 system to perform a complete set of measurements using the L10's direct-coupled balanced inputs and outputs with the input impedance set to High, the gain adjust set to "0dB," feedback set to Local, Phase Polarity set to In Phase, and the Ground Lift switch set to Opened. I then repeated some of the tests using the unbalanced RCA inputs and outputs then did more tests with the magazine's higher-performance APx555. The supplied umbilical cables were long enough for me to place the power supply on the floor, well away from the L10's preamp chassis.
The L10 preserved absolute polarity (ie, was noninverting) with balanced and single-ended inputs and outputs. (Its XLR jacks are wired with pin 2 hot, the AES convention.) The volume control operated in accurate 0.5dB steps, and with it set to the maximum of "18.0dB," the gain was 16dB for the balanced and single-ended inputs to the balanced outputs and 10dB from the unbalanced outputs. Setting the feedback to Global increased these gains by 2dB, matching the display's "18.0dB" via the balanced outputs.
The L10's input impedance set to High is specified as 94k ohms, balanced, and 47k ohms, unbalanced. I measured 94k ohms at 20Hz and 1kHz and 76k ohms at 20kHz for the balanced inputs. The unbalanced input impedance was 42k ohms at low and middle frequencies and a still-high 32k ohms at the top of the audioband. Setting the input impedance to Low gave 596 ohms, balanced, and 299 ohms, unbalanced, both values consistent from 20Hz to 20kHz and very close to the specified values of 600 ohms and 300 ohms. The balanced output impedance was a low 60 ohms; the unbalanced output impedance was 52 ohms.
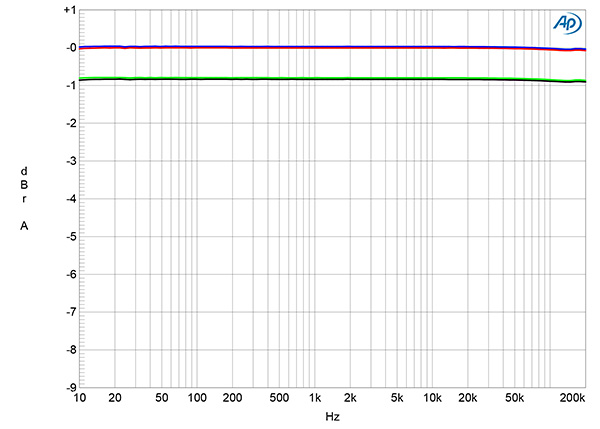
The L10's balanced frequency response was flat from 10Hz to 200kHz into both 100k ohms (fig.1, blue and red traces) and 600 ohms (green and gray traces). Fig.1 was taken with the L10's volume control at its maximum setting. Both the frequency response and the superb channel matching were preserved at lower settings of the control and with the unbalanced inputs and outputs. The CH Precision preamp's channel separation was superbly high, at >130dB in both directions below 3kHz, decreasing only slightly at the top of the audioband.
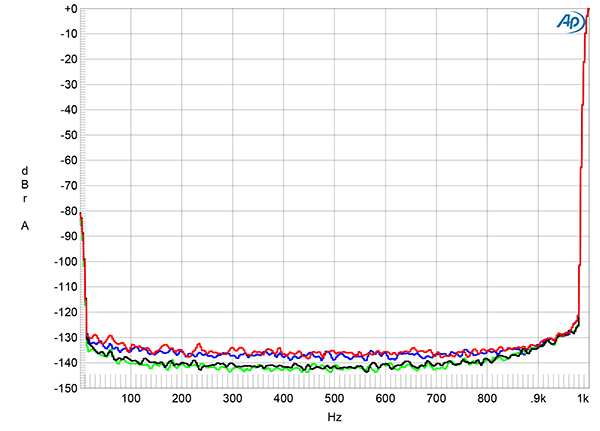
From balanced input to balanced output, the L10 offered extremely low noise, with no power-supply–related spuriae visible (fig.2). The blue and red traces in this graph were taken with the volume control set to the maximum. Repeating the spectral analysis with the control set to unity gain and increasing the level of the input signal so that the output level remained the same reduced the level of the random noise by around 6dB (gray, green traces). The wideband, unweighted signal/noise ratio, measured with the balanced input shorted to ground but the volume control set to its maximum, was a very high 90.6dB ref. 2V output (average of both channels). Restricting the measurement bandwidth to the audioband increased the S/N ratio to a superb 105.9dB. Switching an A-weighting filter into the circuit further improved this ratio, to 108.6dB. Neither the level of the noisefloor nor the S/N ratios changed when I repeated this analysis with the Ground Lift switch set to Linked.
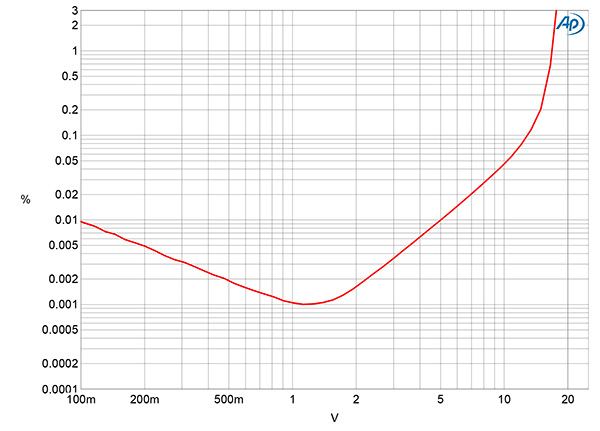
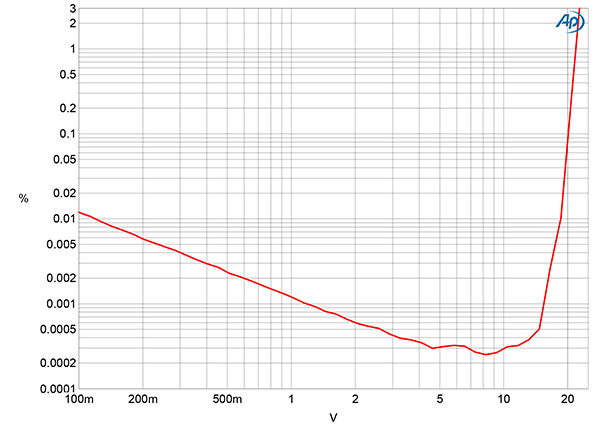
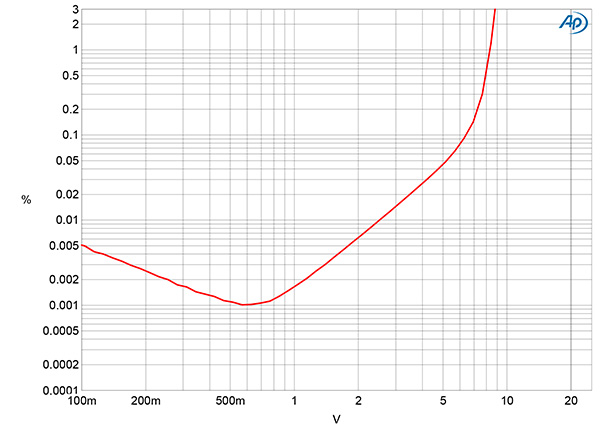
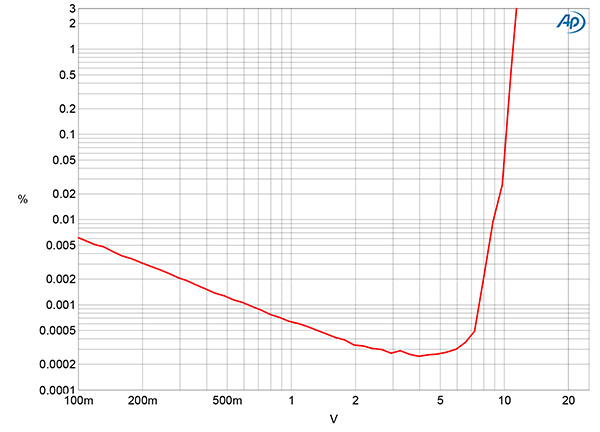
CH Precision specifies the maximum output level as 16V balanced, 8V unbalanced. Fig.3 plots the percentage of THD+noise in the L10's balanced output against the output voltage into 100k ohms, with Local feedback. With the clipping voltage defined as when the THD+N reaches 1%, the balanced output clipped at 17V into 100k ohms, though the THD+N starts to rise above 1.5V. This rise was absent when I repeated this test with Global feedback (fig.4), and the THD+N now reaches 1% at 22.5V. The balanced and unbalanced clipping voltages were slightly lower into 600 ohms (not shown). Repeating this test with the unbalanced output with Local feedback (fig.5) and Global feedback (fig.6) gave similar results, although the L10's unbalanced clipping voltages were half the balanced voltages.
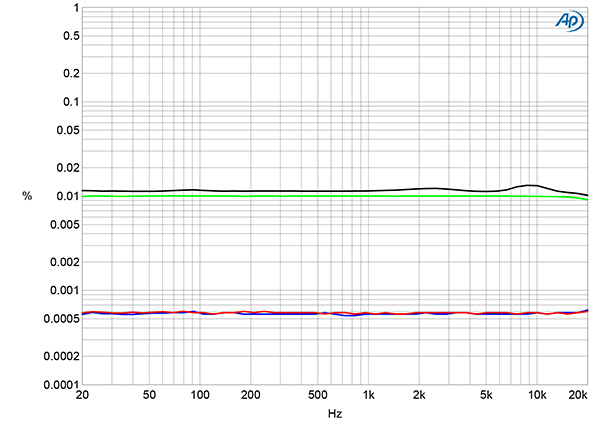
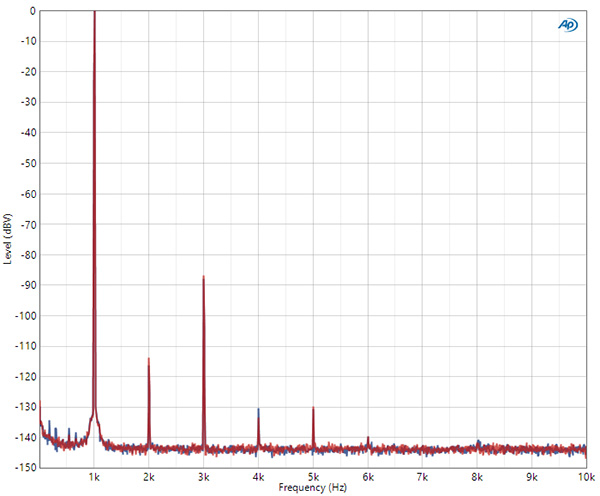
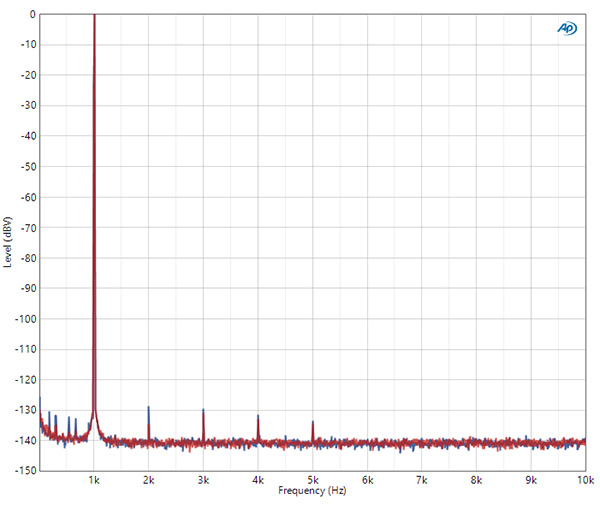
The downward slope below 5V of the Global feedback trace in fig.4 indicates that the distortion lies below the noisefloor. To be sure that the reading was not dominated by noise, I measured how the distortion in the L10's balanced output changed with frequency at 5V. As expected from figs.3 and 4, the THD+noise percentage with Local feedback (fig.7, green and gray traces) was higher than it was with Global feedback (blue, red traces). Commendably, there was no increase in the THD+N in the top audio octaves with either feedback setting, or with the load impedance reduced to the current-hungry 600 ohms. At 5V into 100k ohms with Local feedback (fig.8), the third harmonic was dominant, but at –87dB (0.0014%) it was still very low in level. At the same level with Global feedback (fig.9), the only distortion harmonics visible above the noisefloor lay at –130dB (0.00003%).
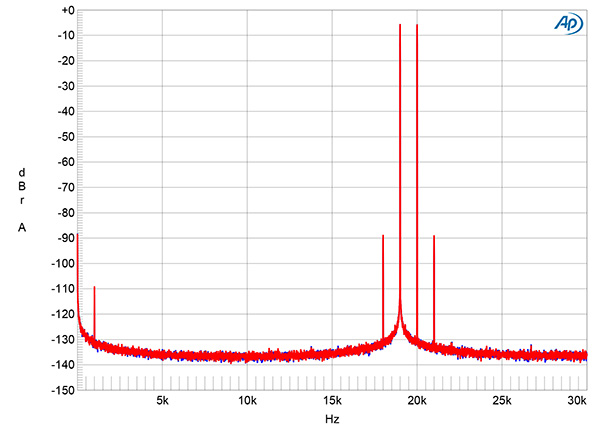
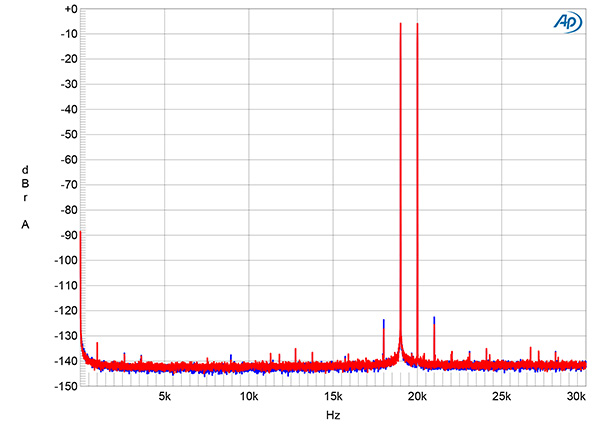
Tested for intermodulation distortion with an equal mix of 19kHz and 20kHz tones at a peak voltage of 4V, the second-order difference product at 1kHz lay at –110dB (0.0003%) with Local feedback (fig.10) and below –130dB with Global feedback (fig.11) even into 600 ohms!
Overall, the CH Precision L10 offered superb measured performance, equaling that of the company's L1 preamplifier, which Jim Austin reviewed in November 2024 and which was Stereophile's Amplification Product of the Year for 2025. While harmonic and intermodulation distortion are higher with Local feedback than with Global feedback, the levels are still too low to have audible consequences.—John Atkinson


