Sidebar 3: Measurements
I performed a full set of measurements on the Cambridge EXN100 using my Audio Precision SYS2722 system, repeating some of the testing with the magazine's higher-performance APx555 analyzer. I used network data streamed with Roon, USB data sourced from my MacBook Pro, and optical S/PDIF data—the TosLink input accepted data sampled at rates up to 192kHz. I adjusted the processor's settings with the StreamMagic V3.0.0 app, installed on my iPad mini. Apple's USB Prober utility identified the Processor as "EXN100" from "Cambridge Audio," with the serial number string "0040ca83," and indicated that the USB port operated in the optimal isochronous asynchronous mode. The AudioMIDI utility revealed that the EXN100 accepts 32-bit integer data via USB sampled at all rates from 44.1kHz to 768kHz.
The EXN100 preserved absolute polarity from its balanced and unbalanced outputs. The volume control operated in 1dB steps at the top of its range and 0.5dB steps below "90." With the volume control set to the maximum, the output levels with a full-scale 1kHz signal measured 4.32V balanced and 2.16V unbalanced. The output impedance from the balanced outputs was 120 ohms at 20Hz and 94 ohms at 1kHz and 20kHz. The impedance from the single-ended outputs was half these values, as expected.

Footnote 1: See fig.3 and 4 here. Footnote 2: In the twos-complement encoding used by 16-bit digital audio, –1 least significant bit (LSB) is represented by 1111 1111 1111 1111, digital zero by 0000 0000 0000 0000, and +1 LSB by 0000 0000 0000 0001. If the waveform is symmetrical, this indicates that changing all 16 bits in the digital word gives exactly the same change in the analog output level as changing just the LSB.
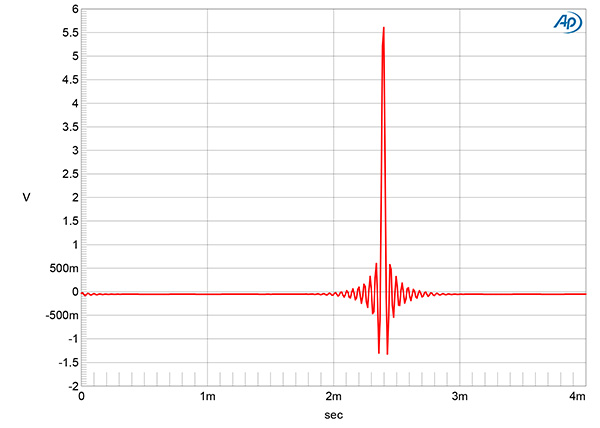
Fig.1 Cambridge EXN100, impulse response (one sample at 0dBFS, 44.1kHz data, 4ms time window).
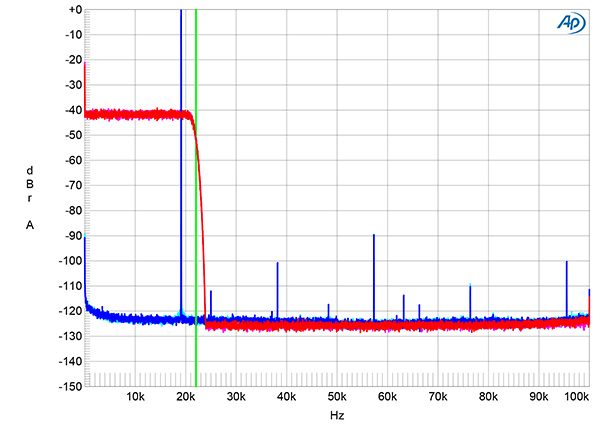
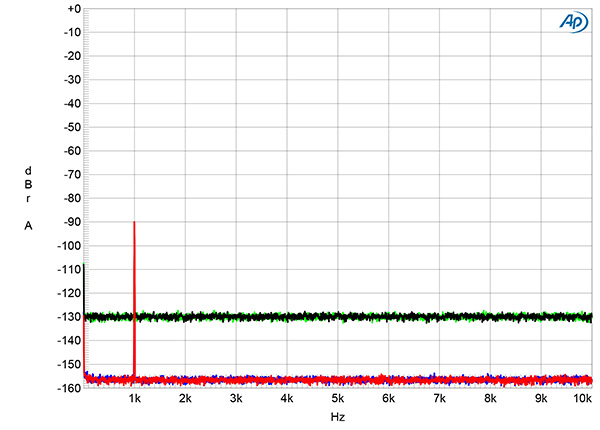
Fig.2 Cambridge EXN100, wideband spectrum of white noise at –4dBFS (left channel red, right magenta) and 19.1kHz tone at 0dBFS (left blue, right cyan) into 100k ohms with data sampled at 44.1kHz (20dB/vertical div.).
There isn't an item in the StreamMagic Settings Menu for choosing a reconstruction filter, so the filter must be fixed. The EXN100's impulse response with data sampled at 44.1kHz (fig.1) indicates that this is a long linear-phase type, with several cycles of ringing before and after the single sample at 0dBFS (footnote 1). The magenta and red traces in fig.2 show the Cambridge's wideband spectrum with white noise data at –4dBFS sampled at 44.1kHz. The EXN100's output rolls off rapidly above the audioband, reaching full stopband attenuation at 24kHz. The image at 25kHz of a 19.1kHz tone at 0dBFS (cyan, blue traces) is therefore suppressed by >110dB. Note the very low levels of harmonic distortion in this graph; the third harmonic is the highest in level but lies at just –90dB (0.003%).
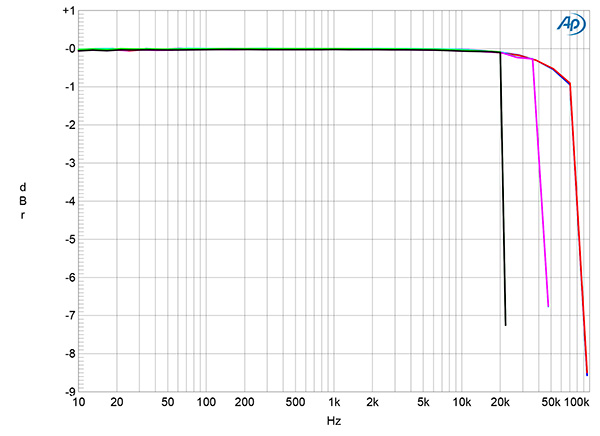
Fig.3 Cambridge EXN100, frequency response at –12dBFS into 100k ohms with data sampled at: 44.1kHz (left channel green, right gray), 96kHz (left cyan, right magenta), and 192kHz (left blue, right red) (1dB/vertical div.).
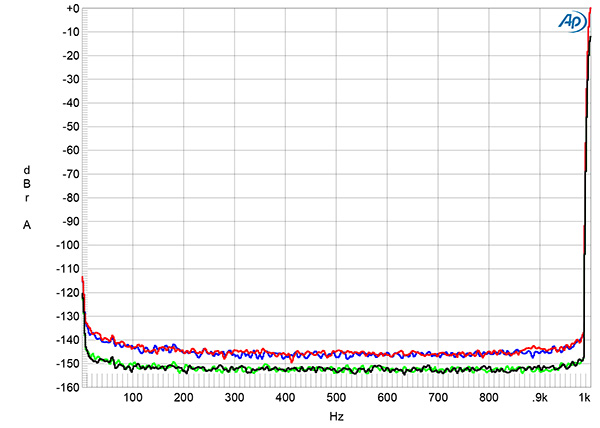
Fig.4 Cambridge EXN100, spectrum of 24-bit 1kHz tone at 0dBFS, DC–1kHz, with volume control set to the maximum (left channel blue, right red) and to –12dB (left green, right gray) (20dB/vertical div.).
The EXN100's frequency response with data sampled at 44.1kHz, 96kHz, and 192kHz (fig.3) rolls off rapidly just below half of each sample rate. Channel separation was superb, at >120dB in both directions below 3kHz and still 110dB at the top of the audioband. The processor's low-frequency noisefloor was free from power supply–related spuriae (fig.4). The blue and red traces in this graph were taken with the volume control set to the maximum. Lowering the volume by 12dB (green, gray traces) reduced the level of the noisefloor by 7–9dB.
Fig.5 Cambridge EXN100, spectrum with noise and spuriae of dithered 1kHz tone at –90dBFS with 16-bit data (left channel green, right gray) and 24-bit data (left blue, right red) (20dB/vertical div.).
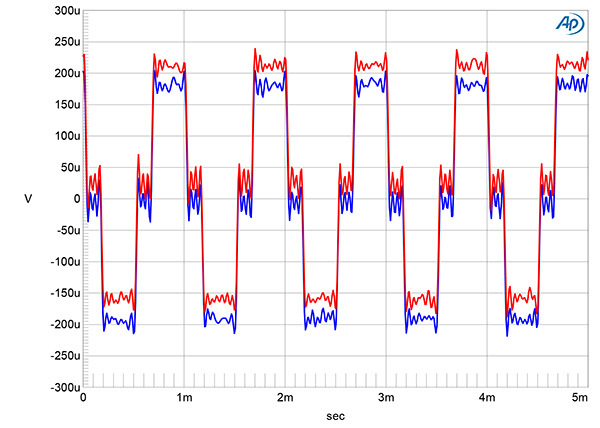
Fig.6 Cambridge EXN100, waveform of undithered 1kHz sinewave at –90.31dBFS, 16-bit data (left channel blue, right red).
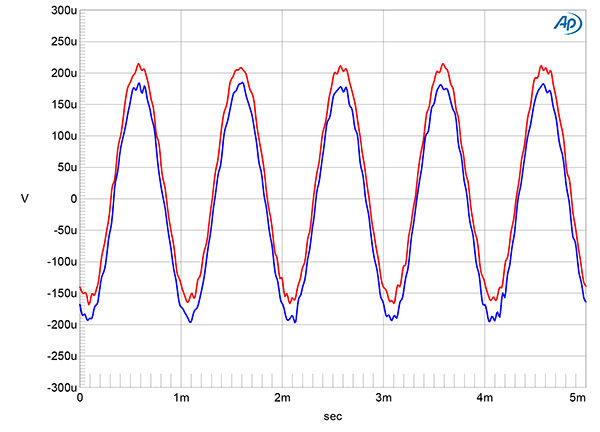
Fig.7 Cambridge EXN100, waveform of undithered 1kHz sinewave at –90.31dBFS, 24-bit data (left channel blue, right red).
When I examined the spectra with 16- and 24-bit dithered data representing a 1kHz tone at –90dBFS, the increase in bit depth lowered the noisefloor by 28dB (fig.5). The measured resolution is therefore excellent, at close to 21 bits. With undithered data representing a tone at exactly –90.31dBFS, the waveform was symmetrical and the three DC voltage levels described by the data were clearly defined (fig.6, footnote 2). With undithered 24-bit data, the EXN100 output a superbly clean sinewave (fig.7).
Fig.8 Cambridge EXN100, spectrum of 24-bit 1kHz sinewave, DC–1kHz, at 0dBFS into 200k ohms, volume control set to –12dB (left channel blue, right red, linear frequency scale).
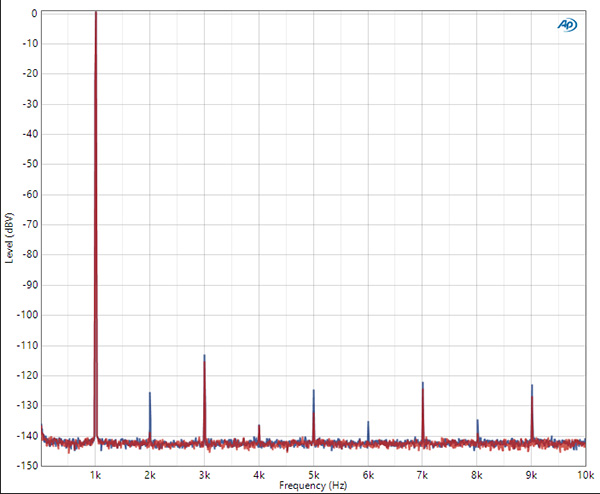
Fig.9 Cambridge EXN100, HF intermodulation spectrum, DC–30kHz, 19+20kHz at 0dBFS into 100k ohms, 24-bit, 44.1kHz data (left channel blue, right red; linear frequency scale).
The Cambridge EXN100's balanced outputs produced primarily third-harmonic distortion, this lying at –114dB (0.0002%) with a 1kHz signal at 0dBFS (fig.8). The third harmonic lay at the same level from the single-ended outputs, but now the second harmonic was a few dB higher in level, at –116dB (0.00015%). Intermodulation distortion with 24-bit data representing an equal mix of 19 and 20kHz tones, each at –6dBFS, was very low in level (fig.9), with the second-order difference product lying close to –130dB (0.00003%). The extremely low levels of the harmonic and intermodulation distortion products didn't change when I repeated these spectral analyses with the demanding 600 ohm load.
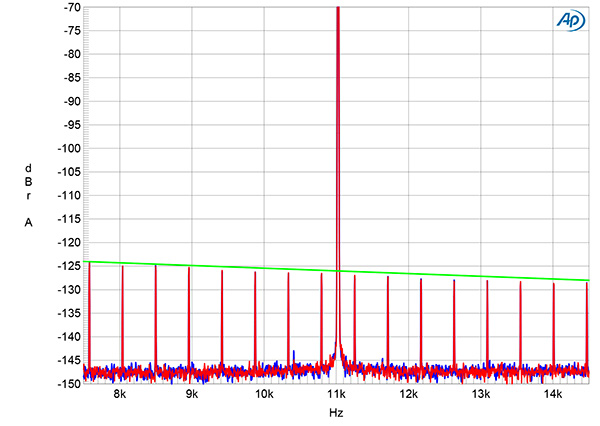
Fig.10 Cambridge EXN100, 16-bit undithered TosLink data, high-resolution jitter spectrum of analog output signal, 11.025kHz at –6dBFS, sampled at 44.1kHz with LSB toggled at 229Hz (left channel blue, right red). Center frequency of trace, 11.025kHz; frequency range, ±3.5kHz.
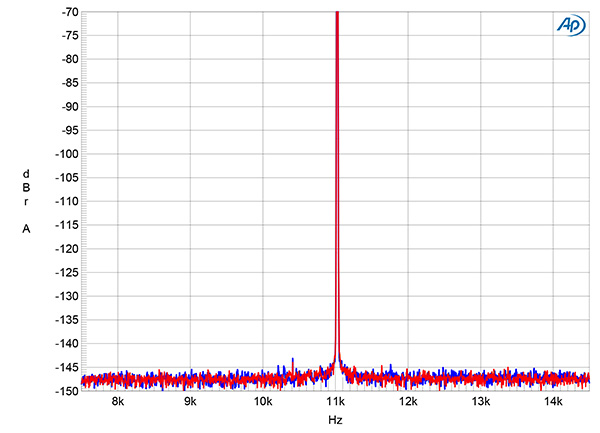
Fig.11 Cambridge EXN100, 24-bit undithered TosLink data, high-resolution jitter spectrum of analog output signal, 11.025kHz at –6dBFS, sampled at 44.1kHz with LSB toggled at 229Hz (left channel blue, right red). Center frequency of trace, 11.025kHz; frequency range, ±3.5kHz.
Even with S/PDIF data, where the word clock is embedded in the datastream, the EXN100 demonstrated excellent rejection of jitter. Fig.10 shows the spectrum of its output when its TosLink input was fed 16-bit J-Test data. The odd-order harmonics of the undithered low-frequency, LSB-level squarewave all lie at the correct levels, and the base of the central spike that represents the high-level tone at one-quarter the sample rate is very narrow. This indicates that there are no low-frequency random jitter products present. Repeating this analysis with 24-bit optical J-Test date gave a superbly clean spectrum (fig.11).
The Cambridge Audio EXN100 LE offers superb measured performance, with high resolution and vanishingly low levels of distortion and noise.—John Atkinson
Footnote 1: See fig.3 and 4 here. Footnote 2: In the twos-complement encoding used by 16-bit digital audio, –1 least significant bit (LSB) is represented by 1111 1111 1111 1111, digital zero by 0000 0000 0000 0000, and +1 LSB by 0000 0000 0000 0001. If the waveform is symmetrical, this indicates that changing all 16 bits in the digital word gives exactly the same change in the analog output level as changing just the LSB.


