The Sigma had a rather high output voltage of 3.5V, nearly 5dB higher than the standard 2V output. Output impedance was very high for a 1992 product, measuring nearly 2k ohms at 20Hz, this dropping to just under 1.5k ohms at 20kHz (footnote 1). It was difficult to get an exact measurement of the output voltage into 600 ohms or lower, it dropping as the output stage became current-limited. I noticed on the oscilloscope connected to the Audio Precision System One's monitor output that the waveform was severely clipped when the Sigma attempted to drive a 600 ohm load at high levels. Moreover, the negative portion of the wave clipped more severely than the positive swing. Fig.1 shows the Sigma's output when driving a full-scale, 1kHz sinewave into 600 ohms.
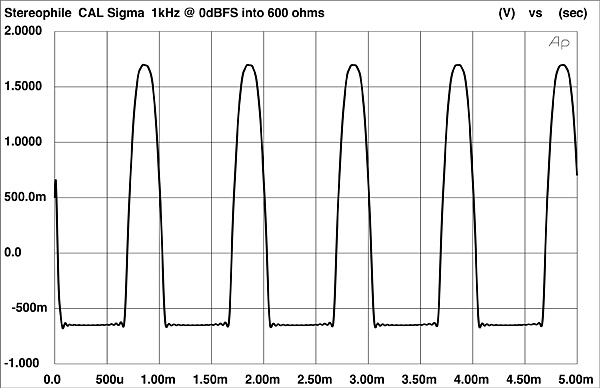
To investigate this behavior in more detail, I connected John Atkinson's Heathkit decade resistance box in parallel with the Audio Precision's input. (The System One provides only 100k ohms, 600 ohms, and 150 ohm loads.) I found that the current limiting shown in fig.1 began when the Sigma drove less than 13.8k ohms. In light of this behavior, passive level controls are definitely not recommended for use with the Sigma. In fact, a high input impedance preamplifier would appear to be a necessity. This very high output impedance may also be responsible for the Sigma's somewhat slow bass quality.
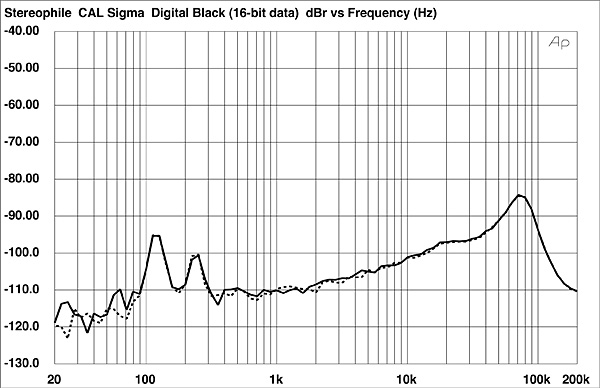
Frequency response, shown in fig.2, exhibited a greater treble rolloff than is typical in digital processors. Moreover, the rolloff began somewhat low in frequency, being down 0.2dB at 10kHz and –0.7dB at 20kHz. This may not seem like much, but when spanning the entire top octave, this amount of treble attenuation could have contributed to the Sigma's subjective impression of smooth treble but a slight loss of air and HF detail.
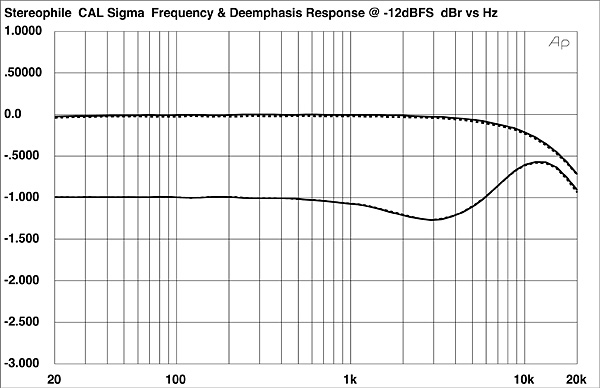
De-emphasis error (fig.2) was greater than is usually measured in digital processors. There was a 0.25dB negative error at 3kHz, and a 0.5dB positive error at 12kHz. This could cause a slight tizz in the upper treble—particularly when juxtaposed with the negative error in the lower treble—when playing pre-emphasized discs. The dip at 3kHz and peak at 12kHz may cause a slight "whitening" of the treble when the de-emphasis circuit is engaged. Interestingly, the Sigma's inherent treble rolloff will closely compensate for the positive de-emphasis error between about 6kHz and 15kHz, restoring a flatter treble response.
It is essential to be aware that such first-order errors may exist when comparing processors. Knowing which discs are pre-emphasized is vital when performing critical listening evaluations. Digital processors not only have significant de-emphasis errors, but also exhibit different amounts of attenuation when the de-emphasis circuit is engaged. Matching levels with an unemphasized test tone doesn't ensure accurate level matching when auditioning the converters with pre-emphasized discs.
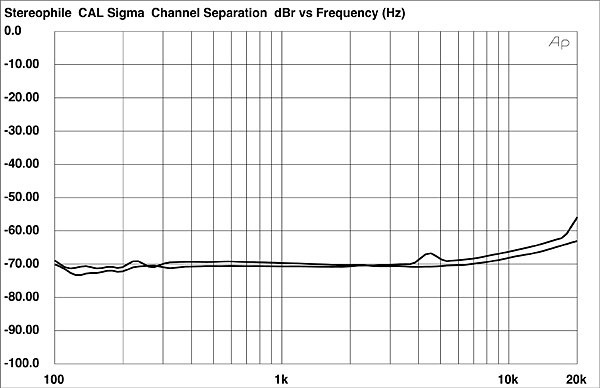
The Sigma's interchannel crosstalk (fig.3) was low, measuring –85dB across most of the band, and decreasing only slightly in the upper treble. The plot, however, is dominated by noise, with the actual crosstalk emerging out of the noise floor at about 7kHz and above.
Driving the Sigma with digital silence (all data words are set to zero) and performing a 1/3-octave spectral analysis on the output produced the plot of fig.4. The HF noise level is fairly low, but the power-supply–related noise, seen as peaks at 120Hz and 240Hz, is moderately high in level (–95dB). It may be difficult to achieve good power-supply noise rejection in such a small chassis, particularly with the Sigma's large power transformer. There are, however, no spikes in the audioband that would indicate converter misbehavior. The effects of the Crystal chip's noise shaping can be seen by the rising noise level above the audioband.
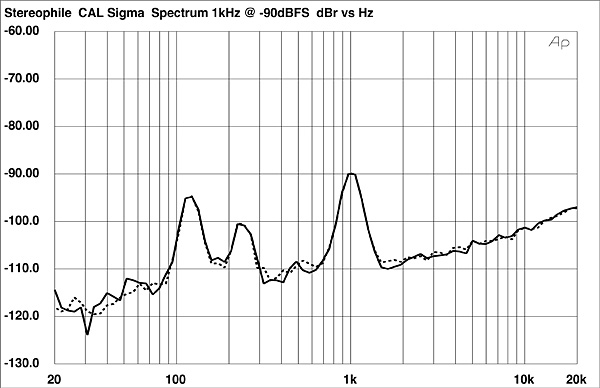
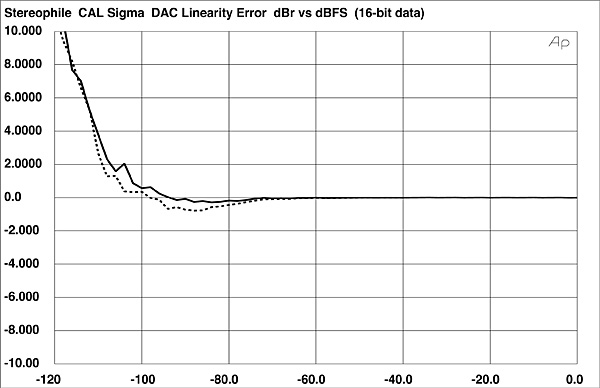
The same type of spectral analysis is shown in fig.5, but this time with the Sigma decoding data representing a dithered –90dB, 1kHz sinewave. The power-supply noise is apparent, the level of HF noise is low, and the linearity looks good. Moreover, the left- and right-channel traces perfectly overlap at the test-tone frequency, indicating the DAC's two channels are well matched. This is confirmed by fig.6, which shows the Sigma's departure from linearity. This is excellent performance: the left channel is virtually perfect to –100dB, while the right has a slight (1dB) negative error at –90dB, which corrects itself, having no error at –100dB. (One-bit converters typically have better low-level linearity than most multi-bit converters.)
The Sigma's noise-modulation plot is shown in fig.7. The traces, made by plotting the spectrum of the noise floor while the processor decodes a 41Hz sinewave at levels ranging from –60dBFS to –100dBFS, are closely grouped, indicating the Sigma's noise floor doesn't vary or change its spectral balance with changing input levels. There is a rise in the noise floor centered at 500Hz, but it is consistent among the traces. This is generally good performance. Interestingly, the noise-modulation plots of CAL's System One D/A converter (Vol.15 No.8, p.143) show a similar peak at 500Hz. This holds true despite the fact that the System One's digital filtering, D/A converters, and overall design are totally different from the Sigma's.
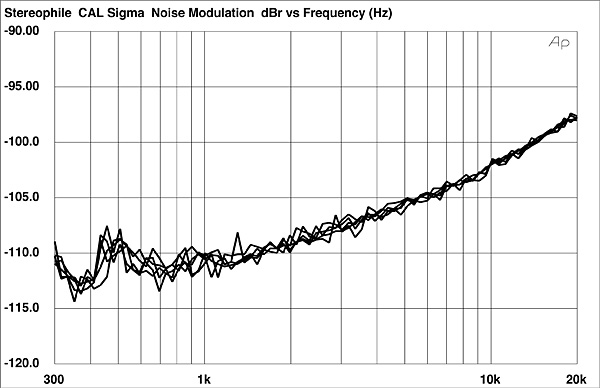
Fig.8 is the Sigma's reproduction of an undithered, 1kHz sinewave at a level of –90dB. The signal is overlaid with a fairly high level of audioband noise. It also looks very slightly asymmetrical, with the negative-going half of the wave having less negative swing. Looking at the full-scale, 1kHz squarewave (fig.9), we can see slightly more overshoot than is typical of most digital filters, particularly on the trailing edge. Compare this waveshape with that of the other converters in this survey.
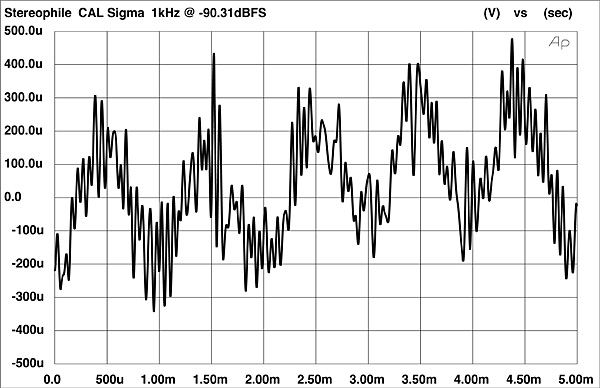
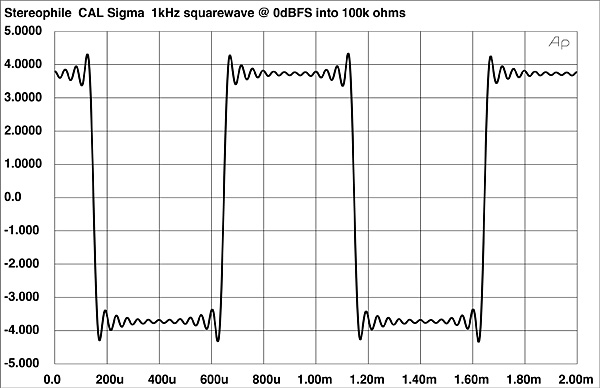
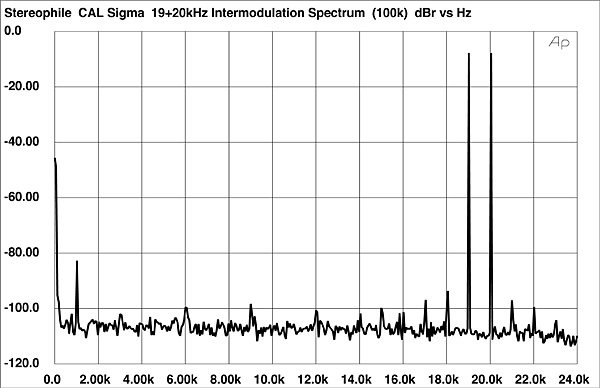
Fig.10 is an FFT-derived spectrum of the Sigma's output when decoding a combination of 19kHz and 20kHz at full scale. The level of sidebands around the test tones is low, but the 1kHz difference product is fairly high at –82dB. The overall noise floor is also slightly higher than the other converters in this survey.
Finally, the Sigma doesn't invert absolute polarity, and I measured a low 100µV of DC at the left channel output and 200µV at the right channel. Overall, the Sigma's bench performance was good for an inexpensive processor.—Robert Harley
Footnote 1: Though high, the Sigma's impedance is not as high as that of the original CAL Tempest, which sourced its signal from 5600 ohms.—John Atkinson