I estimated the voltage sensitivity (using 1/3-octave pink noise centered on 1kHz) and measured the change of impedance with frequency, while the nearfield low-frequency response of each speaker was assessed with a sinewave sweep to get an idea of the true bass extension relative to the level at 100Hz. The frequency response of each speaker in the listening area was measured using pink noise and an Audio Control SA-3050A 1/3-octave spectrum analyzer. Nine sets of six averaged measurements were taken independently for left and right loudspeakers at a distance of just over 2m in a window 72" wide and varying from 27" to 45" high.
The response shown in the review is the average of these measurements, weighted slightly toward the sound heard at the listening position. This spatial averaging is intended to minimize the effect of low-frequency room standing-wave problems on the measurement, and gives a response curve that has proved to correlate reasonably well with what is perceived; it also gives an idea of the off-axis behavior of the speaker under test.
All measurements were performed on my own 11-year-old pair of Rogers LS3/5as, the new samples not arriving in time. The high nature of the original LS3/5a's impedance can be seen from the appropriate graph (fig.1). Dropping below 12 ohms only in the upper bass and the high treble, the LS3/5a's demands for current are few, while the complex nature of the crossover can be seen in the many-peaked nature of the treble. The new version is said to feature a characteristic 11-ohm impedance, which will make it slightly easier to drive. The sealed box is tuned to a high 93Hz.
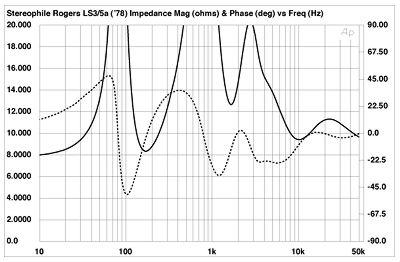
Fig.1 Rogers LS3/5a, 1978 sample, electrical impedance (solid) and phase (dashed) (2 ohms/vertical div.).
The measured voltage sensitivity was very low, at a fraction over 82dB/W/m. Low-powered amplifiers will not drive the speaker to very high levels, yet the limited dynamic headroom means that high-powered amplifiers are to be avoided—a paradoxical design indeed (footnote 1).
In-room, the spatially averaged response (fig.2) holds few surprises: a lumpy upper bass, with no low bass to speak of; a basically smooth curve, tilted up in the top two octaves; the exact "subjective" curve, in fact, drawn back in 1976 by J. Gordon Holt on p.6 of Stereophile Vol.3 No.12. Measured in the woofer's nearfield, the -6dB point was a high 68Hz, the room reinforcing this only slightly to just above 50Hz. The degree of upper-bass boom means that the '3/5a must not be placed near the rear wall in an attempt to add bass weight. The result will be thick and muddy.
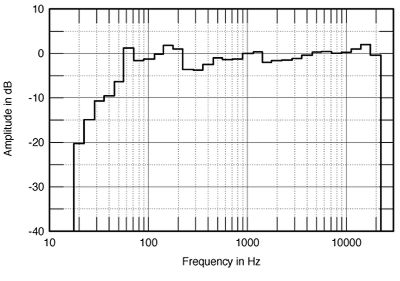
Fig.2 Rogers LS3/5a, 1978 sample, spatially averaged, 1/3-octave response in JA's room.
The slight peak in the 1000-1250Hz region seems to be a consistent feature of the design, but according to Martin Colloms can vary in its height. Modern production is said to be well-behaved in this respect. As is to be expected from a "monitor" design, the pair matching was superb from 200Hz upwards, even when measured at a 2m distance in the listening room. Regarding the rigidity of the enclosure, the LS3/5a was like a rock compared with the other speakers in this report, there only being noticeable sidewall vibration in the 260-360Hz region, and this minor.—John Atkinson
[Postscript: In 1994 I examined the horizontal dispersion of the 1978 samples of the Rogers LS3/5a in a full 360-degree circle. This is shown in fig.3, which didn't appear in the 1989 review, of course. I reexamined the same speaker's on-axis response in 2000. This is shown in fig.4, with the associated waterfall plot shown in fig.5.—John Atkinson]
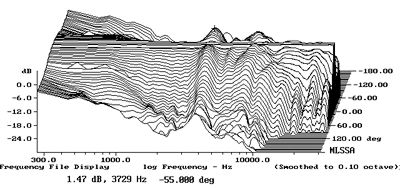
Fig.3 Rogers LS3/5a, 1978 sample, horizontal response family at 50", normalized to response on tweeter axis, from back to front: differences in response 180 degrees-5 degrees off-axis; reference response; differences in response 5 degrees-180 degrees off-axis.
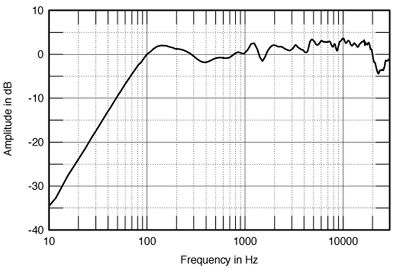
Fig.4 Rogers LS3/5a, 1978 sample, anechoic response on tweeter axis at 50", averaged across 30 degrees horizontal window and corrected for microphone response, with nearfield woofer response plotted below 300Hz.
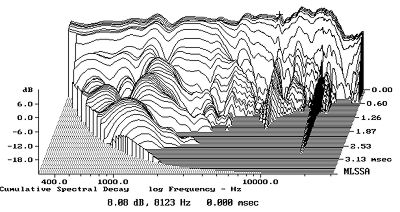
Fig.5 Rogers LS3/5a, cumulative spectral-decay plot at 50" (0.15ms risetime).
Footnote 1: Remember, however, that the 16-ohm impedance of the LS3/5a will mean that amplifiers used with it will have to be downrated. An amp nominally rated at 100W into 8 ohms will only deliver 50W into the LS3/5a before voltage clipping sets in, though it will depend on frequency whether this will occur before the '3/5a's woofer bangs against the end stops.


