Sidebar 2: Measurements
BL2 Input Controller: The BL2 had a very high input impedance of 1.14M ohms, a little lower than the specified 1.5M. At these high impedances, however, an accurate measurement is difficult to obtain. Output impedance was a very low 55 ohms across the band.
The BL2's gain into a 100k load was 5.93dB, fractionally under the 6dB to be expected from converting a single-ended signal into a balanced signal. DC offset levels were quite low, measuring 4.3mV (left channel) and 1.5mV (right channel). The input overload point was greater than 13V RMS.
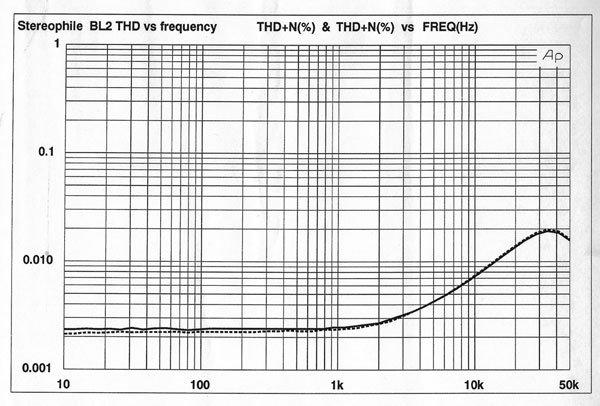
The BL2 had perfectly flat frequency response all the way past the Audio Precision's 200kHz upper frequency limit. At 200kHz, the response was down 0.27dB. The BL2's channel separation was excellent, the crosstalk measuring nearly –120dB at 1kHz, and lower than –90dB at any audio frequency. Similarly impressive was the BL2's low noise level; I measured an unweighted S/N ratio of 93.4dB (left channel) and 96dB (right). (All S/N measurements were made with 22Hz–22kHz bandwidth and referenced to 1V output at unity gain.) These figures increased to 96dB and 99.6dB, respectively, when A-weighted. The BL2's noise and distortion levels (fig.1) were also extremely low—less than 0.003% across most of the band, with a slight rise above 2kHz.
 The volume-control tracking was excellent, measuring just 0.2dB channel imbalance at the low end of the scale (four detents up from fully counterclockwise)—a figure that decreased to 0.06dB over most of the rest of the range. This measurement, which shows how well-matched the left and right elements are in the volume control, implies that the matching is similarly good between the + and – halves of the balanced signal controlled by the four-element potentiometer. This is critical in a balanced preamplifier; any gain mismatch between phases of the balanced signal will decrease common-mode rejection.
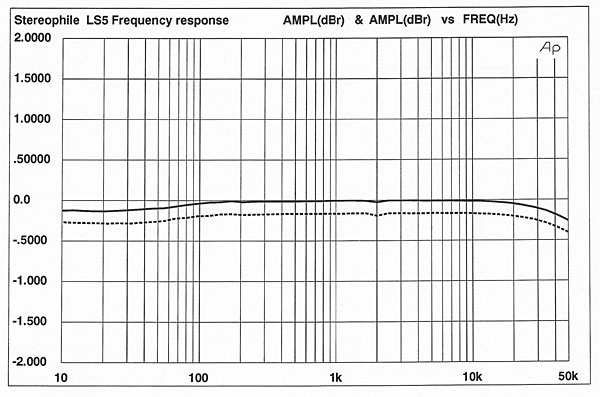
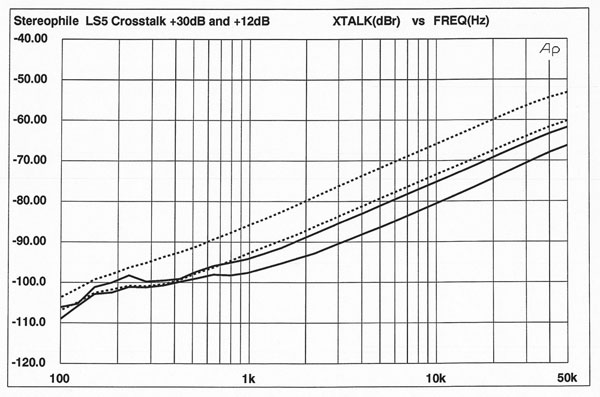
The LS5's frequency response (fig.2) was flat within the audio band, with a 0.25dB rolloff at 50kHz. Channel separation (fig.3) was not as high as I measured from the BL2, but was still excellent. The center pair of traces (one solid, one dotted) are the LS5's channel separation when the unit is selected for 30dB of gain. The second pair are the LS5's channel separation when providing 12dB of gain. As you can see, the right-channel separation decreased (by nearly 10dB) in the low-gain mode, while the left-channel separation increased.
The volume-control tracking was excellent, measuring just 0.2dB channel imbalance at the low end of the scale (four detents up from fully counterclockwise)—a figure that decreased to 0.06dB over most of the rest of the range. This measurement, which shows how well-matched the left and right elements are in the volume control, implies that the matching is similarly good between the + and – halves of the balanced signal controlled by the four-element potentiometer. This is critical in a balanced preamplifier; any gain mismatch between phases of the balanced signal will decrease common-mode rejection.
The LS5's frequency response (fig.2) was flat within the audio band, with a 0.25dB rolloff at 50kHz. Channel separation (fig.3) was not as high as I measured from the BL2, but was still excellent. The center pair of traces (one solid, one dotted) are the LS5's channel separation when the unit is selected for 30dB of gain. The second pair are the LS5's channel separation when providing 12dB of gain. As you can see, the right-channel separation decreased (by nearly 10dB) in the low-gain mode, while the left-channel separation increased.
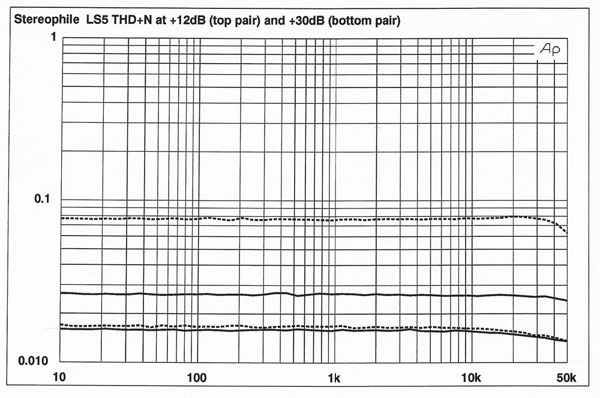
 Measuring the S/N ratio in the 12dB gain mode revealed only slightly poorer performance in the right channel (76.9dB right, 78.2dB left, unweighted). In the "+30" position, the S/N ratio measured 81dB in both channels—a figure that increased to 84dB when an "A"-weighting filter was applied. The bottom pair of traces in fig.4 reflect the LS5's THD+N with 30dB of gain, the upper traces with 12dB of gain. As you can see, the level of spuriae increased in the lower gain position, dramatically so in the right channel (dotted trace). This correlates with the apparently higher right-channel crosstalk in the "+12" mode, and somewhat with the decreased S/N ratio in the right channel with 12dB of gain selected.
 The LS5 Mk.II measured significantly better than the original in some key respects, the biggest difference being between the two units' signal/noise ratios. The LS5's unweighted S/N ratio was 76.9dB (right) and 78.2dB (left) (referenced to 1V output), the Mk.II's 94dB (left) and 96.7dB (right)—a whopping 19.8dB improvement (ie, a tenfold reduction in noise). (All measurements for both the LS5 and the LS5 Mk.II were made over a 22Hz–22kHz bandwidth.)
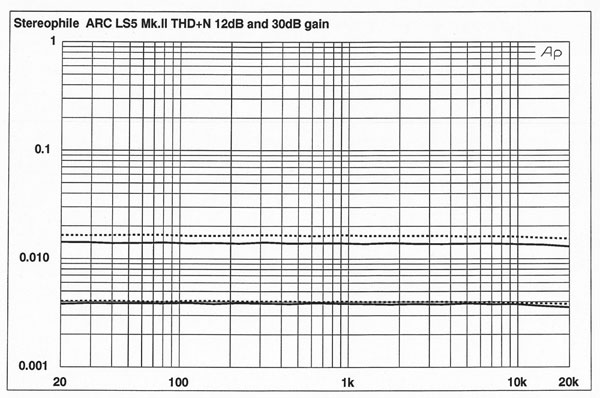
This vastly better noise performance was reflected in the Mk.II's THD+noise plots (fig.8). In the 30dB gain mode, the THD+N was 0.004%; with 12dB of gain, the distortion and noise was 0.016%—nearly an order of magnitude lower distortion and noise compared with the LS5. A comparison of the harmonic distortion spectra revealed the Mk.II's to be nearly identical to that of the LS5.
The LS5 Mk.II measured significantly better than the original in some key respects, the biggest difference being between the two units' signal/noise ratios. The LS5's unweighted S/N ratio was 76.9dB (right) and 78.2dB (left) (referenced to 1V output), the Mk.II's 94dB (left) and 96.7dB (right)—a whopping 19.8dB improvement (ie, a tenfold reduction in noise). (All measurements for both the LS5 and the LS5 Mk.II were made over a 22Hz–22kHz bandwidth.)
This vastly better noise performance was reflected in the Mk.II's THD+noise plots (fig.8). In the 30dB gain mode, the THD+N was 0.004%; with 12dB of gain, the distortion and noise was 0.016%—nearly an order of magnitude lower distortion and noise compared with the LS5. A comparison of the harmonic distortion spectra revealed the Mk.II's to be nearly identical to that of the LS5.
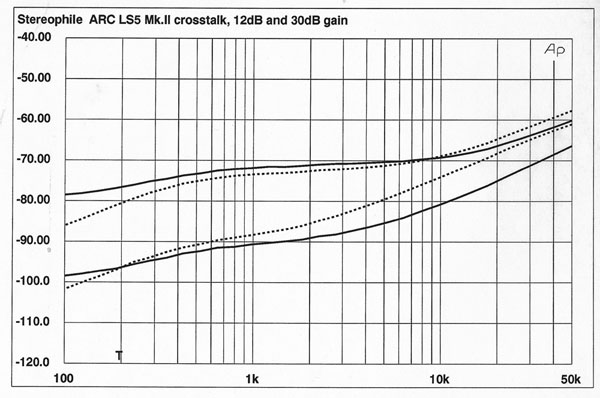
 Interchannel crosstalk decreased slightly overall in the Mk.II (fig.9), and didn't exhibit the odd disparity between gain modes measured in the LS5. In the LS5 sample, the right-channel crosstalk decreased in the low-gain mode compared to the high-gain mode.
 I was greatly impressed by the Mk.II's much better technical performance—particularly the superb volume-control tracking and the 20dB increase in the S/N ratio.—Robert Harley
Fig.1 Audio Research BL2, THD+noise vs frequency (right channel dashed).
Overall, the BL2 had textbook measurements—very low noise, extremely wide bandwidth, high channel separation, and vanishingly low distortion.
LS5 Mk.I preamplifier: I measured an input impedance of 197k ohms for the LS5, this within measurement error of the specified 200k ohms. I wondered why Audio Research chose an extremely high input impedance for the BL2 (1.5M ohms), but a much lower (but still highish) input impedance of 200k ohms for the LS5. The LS5's output impedance was a moderate 415 ohms, suggesting it should easily drive any power amplifier input. The output impedance measured at the tape-out jacks was a rather high 2k ohms. DC levels were a very low 0.4mV from the left and right channels, respectively.
I measured a gain of 29dB with the gain switch in the "+30" position, 11.3dB in the "+12" position. Although 29dB is a lot of gain for a line stage, the LS5 sounded its best in this position. The "+12" setting should therefore be considered a convenience when using very-high-output source components.
Fig.2 Audio Research LS5, frequency response (right channel dashed, 0.5dB/vertical div.).
Fig.3 Audio Research LS5, crosstalk (from top to bottom): R–L, 12dB of gain; R–L, 30dB of gain; L–R, 12dB of gain; L–R, 30dB of gain (10dB/vertical div.).
Fig.4 Audio Research LS5, THD+noise vs frequency with (from top to bottom): 12dB of gain; 30dB of gain (right channel dashed).
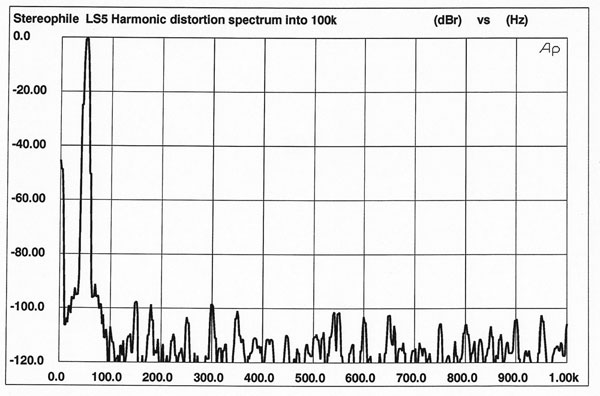
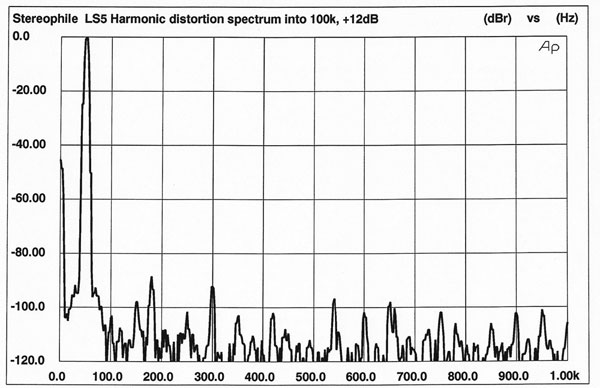
To further investigate the difference in measured performance and sound quality between the two gain modes, I looked at the LS5's distortion spectrum in both gain settings. Fig.5 is an FFT-derived spectrum of the LS5's output when driving a 50Hz sinewave into a 100k ohm load at 1V RMS with 30dB of gain selected on the LS5. For comparison, fig.6 represents the same test conditions, but with 12dB of gain in the LS5. Although they're quite similar, in that the predominant harmonics present are the third and fifth, the power-supply harmonics at 180Hz, 300Hz, and 540Hz are higher in level in the 12dB gain mode, confirming that the difference in the fig.4 traces was due to increased noise rather than to distortion.
Fig.5 Audio Research LS5, 30dB of gain, spectrum of 50Hz sinewave, DC–1kHz, at 1V into 100k ohms (linear frequency scale). Note that the third harmonic at 150Hz is the highest in level, at –97dB (0.0014%).
Fig.6 Audio Research LS5, 12dB of gain, spectrum of 50Hz sinewave, DC–1kHz, at 1V into 100k ohms (linear frequency scale). Note that the power-supply components at 180Hz, 300Hz, and 540Hz are higher in level than any distortion harmonics.
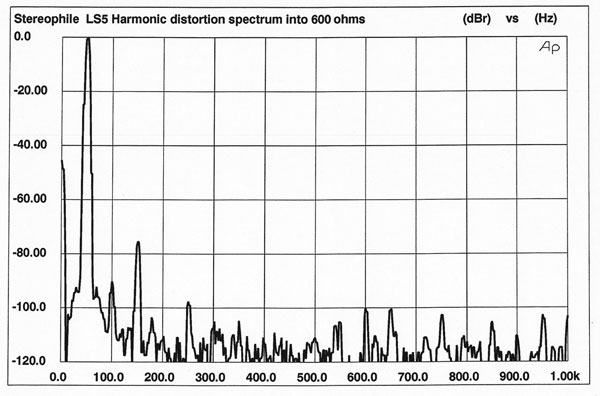
To see how the LS5 behaved when driving a lower impedance, I performed the same test into 600 ohms with 30dB of gain (fig.7). The distortion spectrum changes, with the third-harmonic dramatically increasing in level and the second harmonic making an appearance. Loads this low are best avoided.
Fig.7 Audio Research LS5, 30dB of gain, spectrum of 50Hz sinewave, DC–1kHz, at 1V into 600 ohms (linear frequency scale). Note that the third harmonic at 150Hz is the highest in level, at –76dB (0.015%).
LS5 Mk.II preamplifier: I performed a complete set of measurements on the Mk.II, but have reported on its measured performance only when it differed from that of the LS5.
The Mk.II's volume-control tracking was amazingly good, eclipsing even the superb performance of the potentiometer used in the LS5. The best case was with the volume control barely open (1V in, 100mV out), when the left-right tracking was within 0.005dB. At any other volume setting, the left-right volume tracking was better than 0.008dB. This virtually perfect left-to-right tracking suggests that the Mk.II's four-element potentiometer is equally precise between the two halves of the balanced signal—a vital factor in a fully balanced preamplifier.
Fig.8 Audio Research LS5 Mk.II, THD+noise (%) vs frequency set to 30dB gain (bottom) and 12dB gain (top) (right channel dashed).
Fig.9 Audio Research LS5 Mk.II, channel separation set to 30dB gain (bottom) and 12dB gain (top) (10dB/vertical div.).
The LS5's and LS5 Mk.II's input impedances, output impedances, gains, frequency responses, and DC levels were all similar.