Sidebar 3: Measurements
I measured the VAC Signature SE's electrical performance with my Audio Precision SYS2722 system (see www.ap.com and the January 2008 "As We See It"). The cramped space on my test bench meant that I had to place the audio enclosure atop the power supply, but I separated them with 3" spacers.
Looking first at the performance of the line inputs, the left channel's maximum gain into 100k ohms was the same in balanced and unbalanced modes, at 10dB rather than the specified 12dB. This will not be an issue in practice. Feeding the preamplifier an unbalanced signal and measuring the output at the balanced jacks gave the same 10dB maximum gain. Both modes preserved absolute polarity (ie, were non-inverting), the XLRs being wired with pin 2 hot.
The line input impedance was the same for balanced and unbalanced modes, and varied with frequency, measuring 27k ohms at 20Hz, 58k ohms at 1kHz, and 11.5k ohms at 20kHz. Again, this will not be an issue in use. The output impedance was also the same for both operational modes and was very low, at 114 ohms at middle and high frequencies, and 109 ohms at the bottom of the audioband.
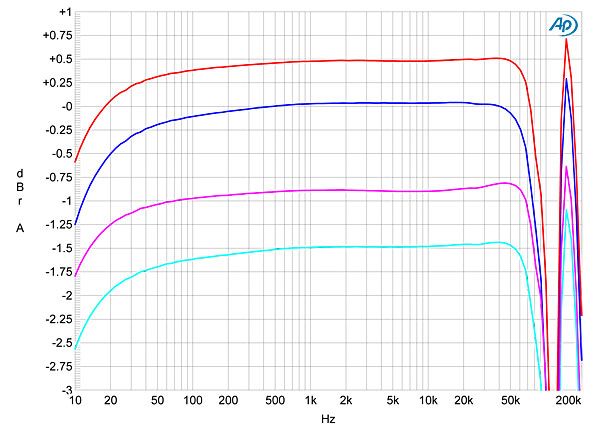
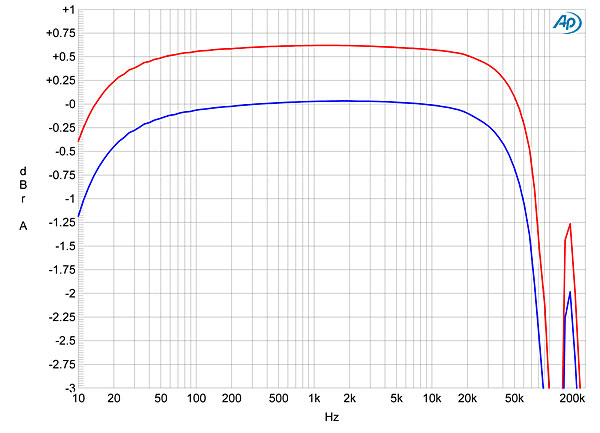
The Signature SE's frequency response was the same for both balanced and unbalanced modes, and was virtually identical into 100k and 600 ohms (fig.1). There was a very slight rolloff at low frequencies, reaching –0.5dB at 20Hz, and while the response is flat up to 50kHz, a resonant peak centered on 150kHz is visible into both impedances. The height of this peak depended on the volume-control setting; turning the control down to its 12 o'clock position reduced the peak by 2dB (fig.2). Note that the channel imbalance, which favors the right channel by 0.5dB, is the same at both volume-control settings, which suggests that it is perhaps due to mismatched tubes rather than to the control potentiometer.
 Channel separation via the line inputs was very good, at better than 85dB, R–L, and 95dB, L–R, at all audio frequencies. The VAC was also a quiet preamp: with the input shorted to ground but the volume control set to its maximum—the worst-case situation—the left channel's unweighted wideband signal/noise ratio was 86.9dB ref. 1V output, and the right's was even better, at 89.9dB. An A-weighting filter improved these ratios to 102.3 and 107.4dB, respectively. Spectral analysis of the preamp's output while it drove 1kHz into 100k ohms (fig.3) reveals that the highest-level spuriae are at 60 and 180Hz, which suggests that they stem from magnetic interference from the power-supply transformer. They are higher in the left channel than the right, but are still very low in absolute terms in both channels.
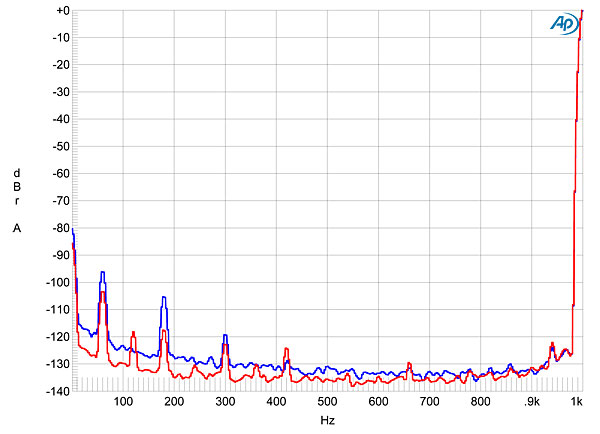
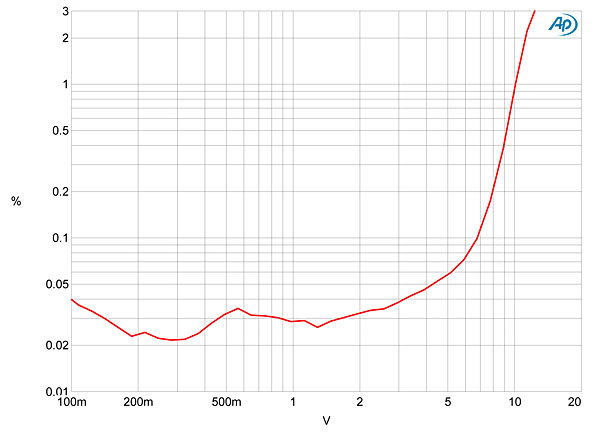
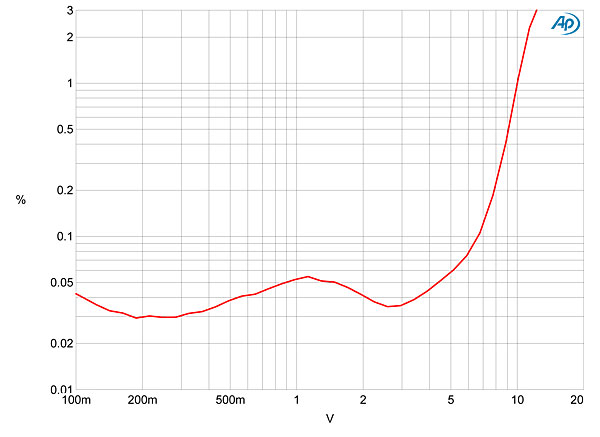
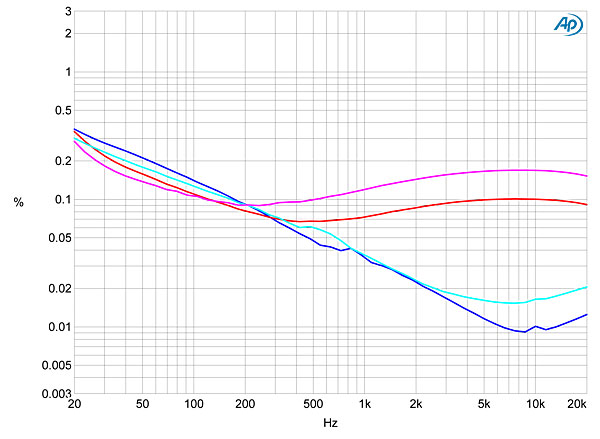

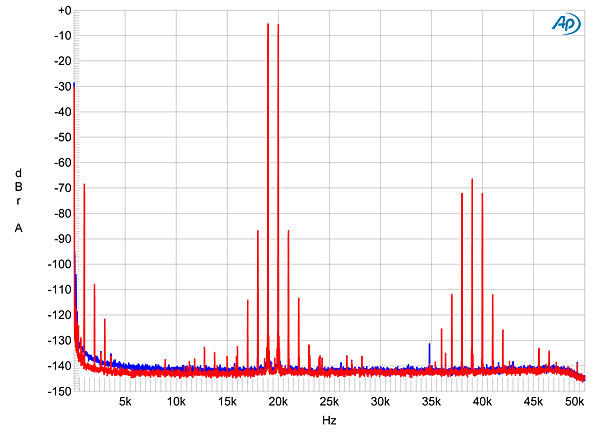
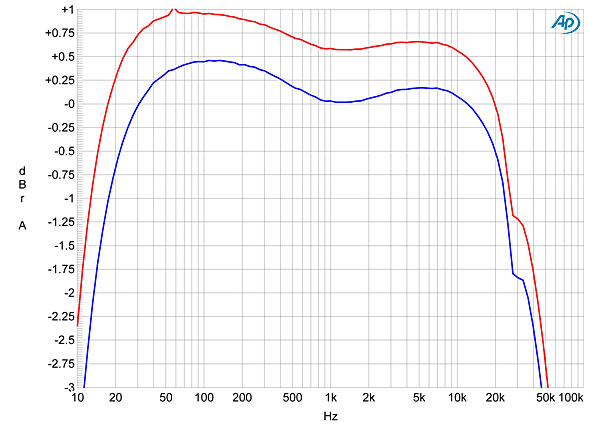
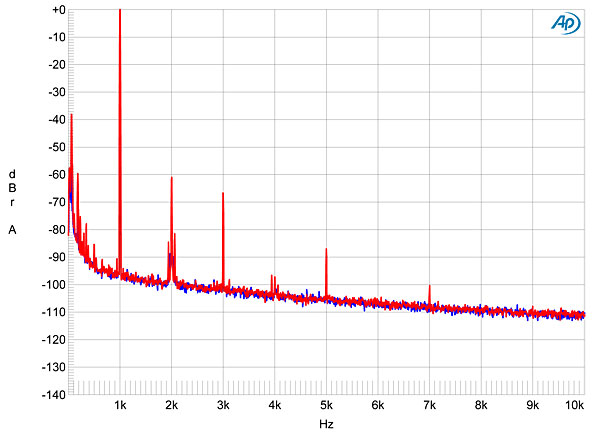
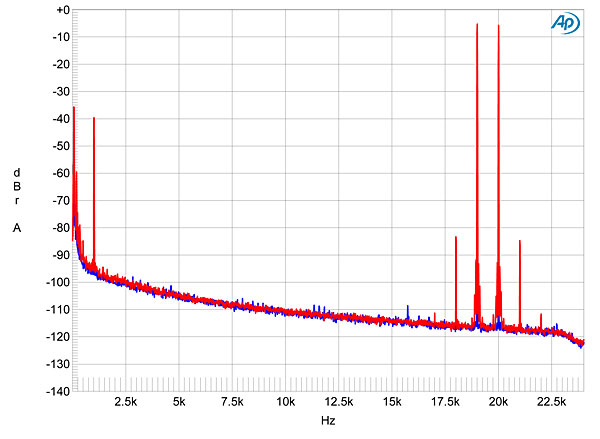
Fig.1 VAC Signature SE, balanced frequency response with volume control set to maximum gain at 1V, into: 100k ohms (left channel blue, right red), 600 ohms (left cyan, right magenta) (0.5dB/vertical div.).
Fig.2 VAC Signature SE, balanced frequency response with volume control set to 12 o'clock at 1V into 100k ohms (left channel blue, right red) (0.5dB/vertical div.).
Fig.3 VAC Signature SE, balanced spectrum of 1kHz sinewave, DC–1kHz, at 2V into 100k ohms (left channel blue, right red) (linear frequency scale).
Figs. 4 and 5 respectively plot the percentage of THD+noise in the Signature SE's output against output voltage for balanced and unbalanced operation. The distortion is very low at all levels that the preamplifier will be required to deliver in practical use, and while the THD starts to rises above 3V, actual clipping doesn't occur until 10V in either mode. Reducing the load to 600 ohms drops the clipping point to 8.5V, but the THD+N remains well below 0.1% up to 5V into this punishing load.
Fig.4 VAC Signature SE, balanced distortion (%) vs 1kHz output voltage into 100k ohms.
Fig.5 VAC Signature SE, unbalanced distortion (%) vs 1kHz output voltage into 100k ohms.
I measured how the THD+N percentage changed with frequency at 2V, close to the maximum level the VAC preamp will be required to deliver in use. The results into 100k and 600 ohms are shown in fig.6. Both channels feature a linear but gentle rise in distortion as the frequency decreases, but the left channel (blue and cyan traces) has significantly lower THD+N in the treble than does the right (red, magenta). Again, this may be due to a tube mismatch. Fig.7 shows the spectrum of a 50Hz tone at the same level. A regular series of odd harmonics can be seen, with the right channel (red trace) featuring a little more second-harmonic than the left (blue). The third harmonic is the highest in level, at –54dB (0.2%). Intermodulation distortion, however, was low (fig.8), the 1kHz difference product resulting from an equal mix of 19 and 20kHz tones lying at –69dB (0.03%).
Fig.6 VAC Signature SE, balanced distortion (%) vs frequency at 2V into: 100k ohms (left channel blue, right red), 600 ohms (left cyan, right magenta).
Fig.7 VAC Signature SE, balanced spectrum of 50Hz sinewave, DC–1kHz, at 2V into 100k ohms (left channel blue, right red) (linear frequency scale).
Fig.8 VAC Signature SE, balanced HF intermodulation spectrum, DC–50kHz, 19+20kHz at 2V into 100k ohms (left channel blue, right red) (linear frequency scale).
Turning to the Signature SE's optional phono stage, I measured its behavior at the main outputs, so the measured performance includes that of the line stage. There are two phono inputs, one with a measured maximum gain of 54.7dB, the other 72.1dB. As the line stage offers 10dB of gain, these are respectively equivalent to 44.7 and 62.1dB, appropriate loadings for, respectively, moving-magnet and moving-coil cartridges. Both phono inputs were non-inverting. The MM input impedance was appropriately high at 1kHz, at 45k ohms, though it rose to 62k ohms at 20Hz and dropped to 30k ohms at 20kHz. The MC input has a rotary knob to select input impedance. However, I found that the measured impedance was not very close to each setting's nominal value. At 1kHz, the "470" setting measured 750 ohms, "300" was 488 ohms, "250" was 408 ohms, "200" was 331 ohms, "150" was 253 ohms, and "100" was 172 ohms. The matches were slightly better at 20kHz, with the measured impedances 229, 208, 197, 182, 161, and 129 ohms. However, at 20Hz, the measured impedance remained between 36 and 39 ohms regardless of the load setting. The Signature SE owner should not go by the indicated load, but experiment with the setting that works best with the MC cartridge used.
The phono stage's RIAA error is shown in fig.9. The channel imbalance is due to the line stage (see figs. 1 and 2), and the two channels' equalization actually matches closely, with a boost of almost 0.5dB in the upper bass and –3dB points of 10Hz and 45kHz. Channel separation at 1kHz was good, at 60dB in both directions, while the noise was low, even with the moving-coil input, which offered S/N ratios of 54dB (wideband, unweighted) and 71dB (A-weighted), both ref. 1kHz at 500µV and taken with the input shorted and the volume control set to its maximum.
Fig.9 VAC Signature SE, phono input, response with RIAA correction (left channel blue, right red) (0.5dB/vertical div.).
Fig.10 shows the spectrum of the Signature SE's output with the MC input fed a 1kHz tone at 500µV. The second harmonic is the highest level, at –60dB (0.1%). Fig.11 shows the spectrum of the preamp's output with the high-gain phono stage fed an equal mix of 19 and 20kHz tones at a level equivalent to 1kHz at 500µV. The 1kHz difference component lies at –40dB (1%), though the higher-order products are respectably low in level. Even so, the overload margin at 20kHz was good, at 14.2dB, MC, and 11.3dB, MM (ref. 1kHz at 5mV and 500µV, respectively). The margins were equally good at 1kHz, but dropped to a disappointing 1.3dB, MC, and 2.5dB, MM, at 20Hz. (These figures will be affected by the decreasing linearity of the line stage at low frequencies, of course.)
Fig.10 VAC Signature SE, high-gain phono input, spectrum of 1kHz sinewave, DC–10kHz, at 500µV input, 2V into 100k ohms (left channel blue, right red) (linear frequency scale).
Fig.11 VAC Signature SE, high-gain phono input, spectrum of 19+20kHz sinewaves, DC–24kHz, at 500µV RIAA-equalized input, 2V into 100k ohms (linear frequency scale).
The Valve Amplification Company's Signature SE preamplifier measures well in many respects, but I was concerned by the line stage's channel mismatch, and by the phono stage's poor overload margin at the bottom of the audioband and its high intermodulation distortion at the top of the audioband. I suspect that it is best suited to phono cartridges with a lower-than-usual output level.—John Atkinson