Sidebar 3: Measurements
I performed a full set of measurements on the TEAC UD-701N using my Audio Precision SYS2722 system. I started the testing by examining the performance of the UD-701N's DAC. I used the coaxial and optical S/PDIF inputs, both of which accepted data sampled at rates up to 192kHz, and USB data sourced from my MacBook Pro running on battery power. I also connected the UD-701N to my network and installed the TEAC HR Streamer app on my iPad mini. The app doesn't appear to allow access to the processor's settings, however; it's just for playback including the usual streaming services as well as Roon. I adjusted the settings with the front-panel Menu button and the remote.
The USB Prober utility identified the D/A processor as "MODEL_NAME TEAC USB AUDIO DEVICE" from "TEAC Corporation," with the serial number string "\001," and indicated that the USB port operated in the optimal isochronous asynchronous mode. Apple's AudioMIDI utility showed that the UD-701N accepted 16-bit, 24-bit, and 32-bit integer data via USB with 16-bit data accepted with sample rates up to 1356kHz! (I assume the last applies to DSD-encoded input data.) The maximum sample rate with 24-bit and 32-bit PCM data was a still-impressive 768kHz.
The DAC operated in several modes via four settings. First, users can set "upconversion" to native, 2×, 4×, or 8×Fs. Next, multibit or single-bit (DSD) delta-sigma modulator output can be chosen. Finally, the delta-sigma modulator sampling frequency can be set to 128×, 256×, or 512×Fs. Here, Fs refers to the original sampling frequency; upconverting the input does not affect the delta-sigma modulator output sampling frequency. There's a choice of two low-pass filters for DSD, which smooths the data resulting in analog output; it can also be switched off. I performed complete sets of digital-input tests in all the upsampling modes, repeating some of the tests with upsampling turned off.
The TEAC's digital inputs preserved absolute polarity from the balanced and unbalanced line outputs, and from the balanced and unbalanced headphone outputs. With the line output mode set to "variable," the volume control operated in 2dB steps at the top of its range, these reducing first to 1.5dB steps, then to 1dB steps at settings of "85" and below. With a 1kHz tone at –12dBFS, the headphone outputs clipped unless I reduced the volume from "100" to "96," when the output voltage was 8.9V, balanced, and 5.6V, unbalanced. With the volume control set to the maximum, the UD-701N's line output levels with the 1kHz signal at –12dBFS were 7.6V, balanced, and 7.2V, unbalanced. As is often the case, the TEAC's digital inputs offer excessive gain, though this does mean that the analog noisefloor will be lower in level at lower volume settings (see later). The output impedances were all usefully low: 247 ohms at 20Hz, 228 ohms at 1kHz and 20kHz, for the balanced line out; 65 ohms at 20Hz, 62.3 ohms at 1kHz and 20kHz, for the single-ended line output; 25 ohms from 20Hz to 20kHz for the balanced headphone output; and 11.7 ohms across the audioband for the unbalanced headphone output.
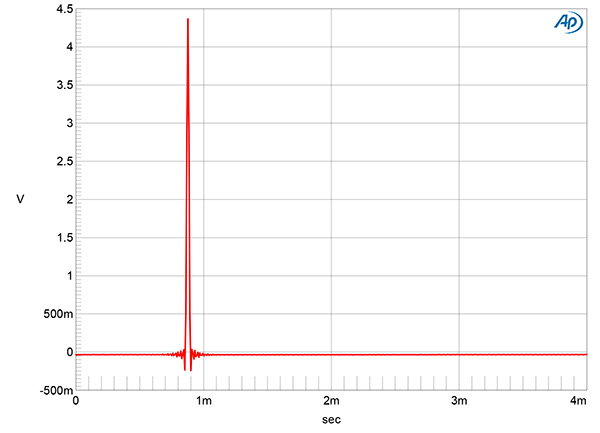
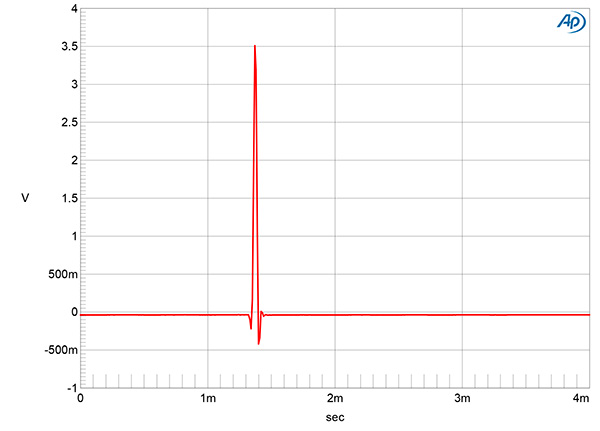
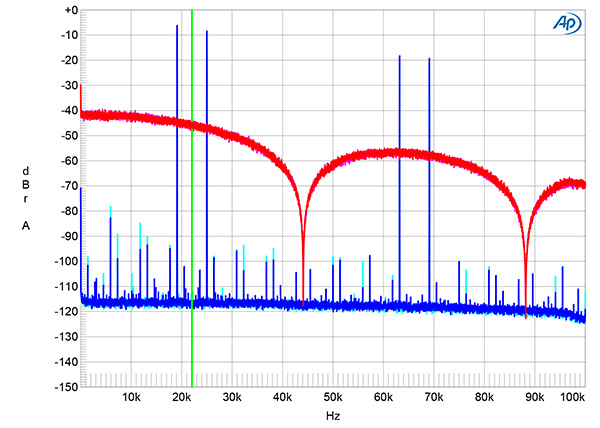
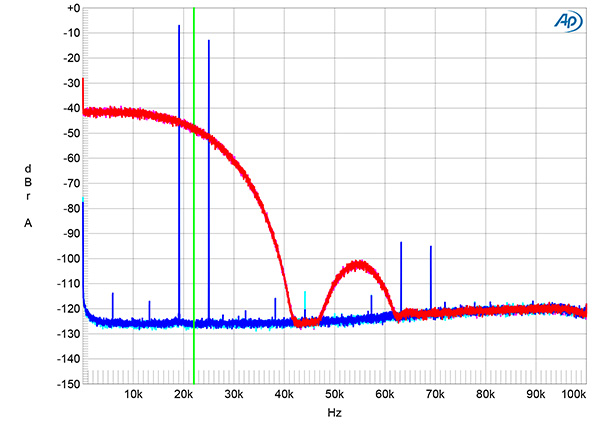
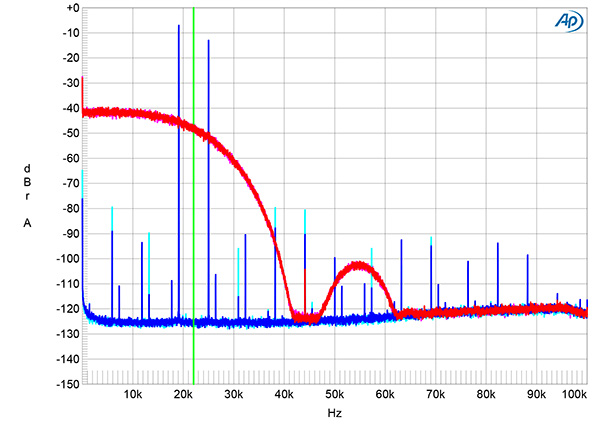
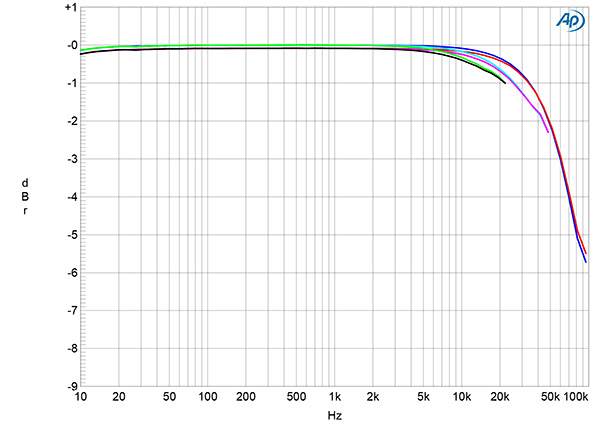
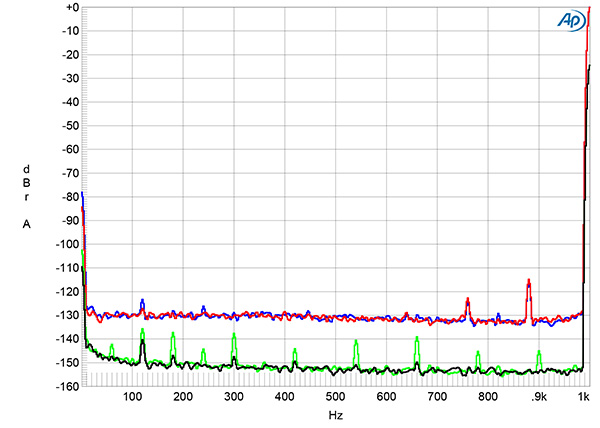
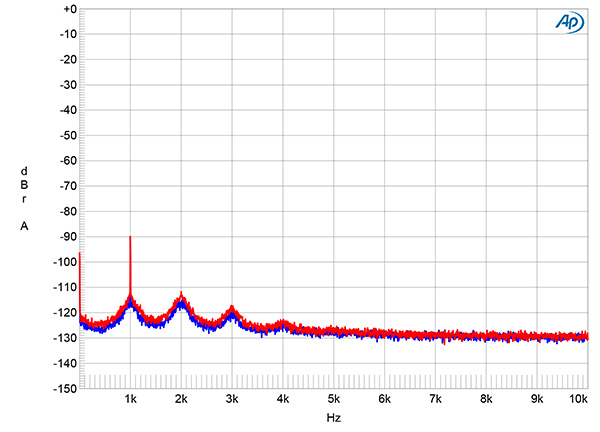
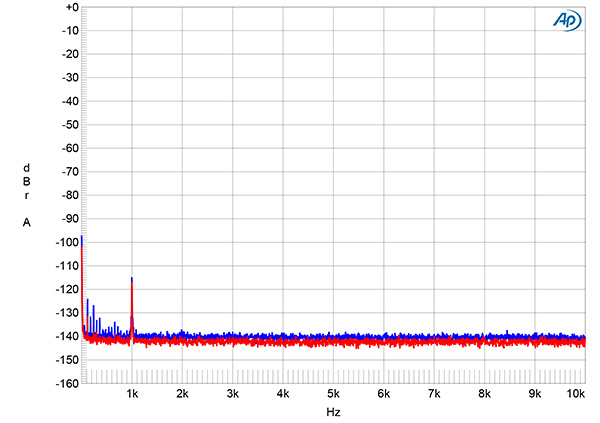
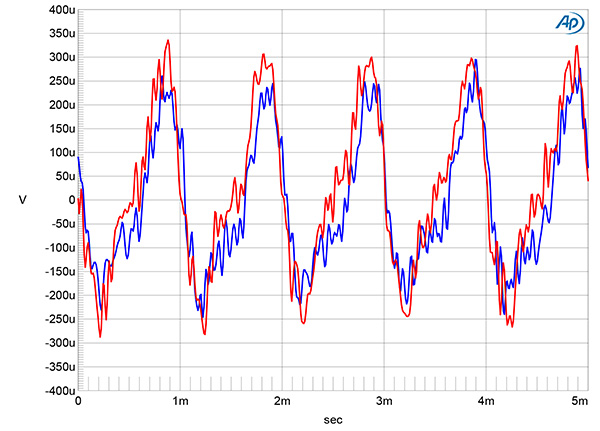
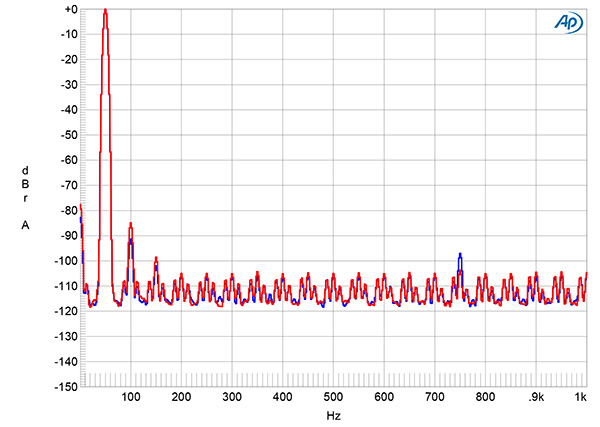
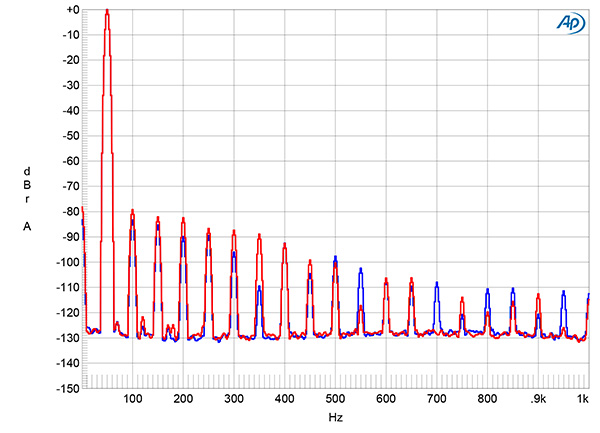
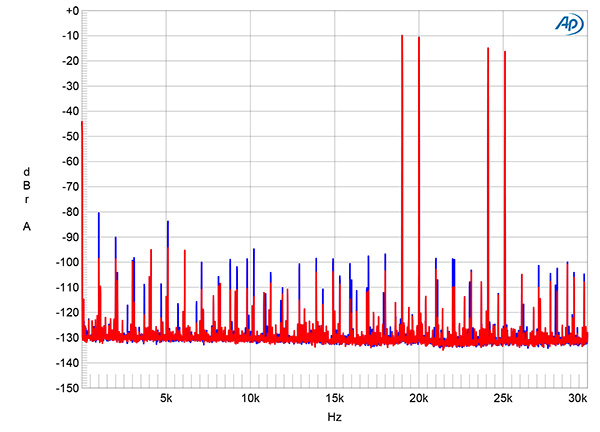
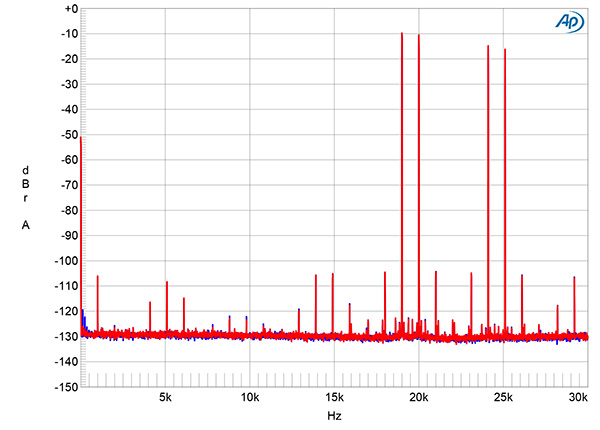
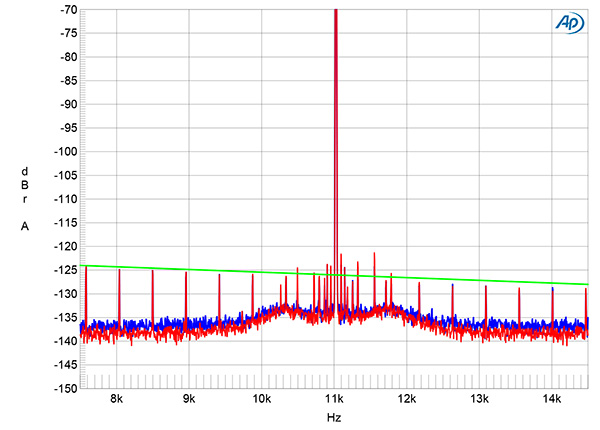
Fig.1 TEAC UD-701N, digital inputs, no upsampling, impulse response (one sample at 0dBFS, 44.1kHz data, 4ms time window).
Fig.2 TEAC UD-701N, digital inputs, DSD upsampling, impulse response (one sample at 0dBFS, 44.1kHz data, 4ms time window).
Fig.1 shows the UD-701N's impulse response with USB data sampled at 44.1kHz and upsampling turned off. There is no reconstruction filter; the impulse response is a time-perfect delta function, with none of the usual ringing before and after the single sample at 0dBFS. (The tiny amount of ringing in this graph is due to the Audio Precision's antialiasing filter.) With all the upsampling modes, the impulse response had the one cycle of ringing before the single sample at 0dBFS due to the Audio Precision's ADC, with the postsample ringing slightly greater in amplitude (fig.2).
Fig.3 TEAC UD-701N, digital inputs, upsampling off, wideband spectrum of white noise at –4dBFS (left channel red, right magenta) and 19.1kHz tone at –3dBFS (left blue, right cyan) into 100k ohms with data sampled at 44.1kHz (20dB/vertical div.).
Fig.4 TEAC UD-701N, digital inputs, DSD upsampling, Filter 1, wideband spectrum of white noise at –4dBFS (left channel red, right magenta) and 19.1kHz tone at –3dBFS (left blue, right cyan) into 100k ohms with data sampled at 44.1kHz (20dB/vertical div.).
Fig.5 TEAC UD-701N, digital inputs, DSD upsampling, Filter 2, wideband spectrum of white noise at –4dBFS (left channel red, right magenta) and 19.1kHz tone at 0dBFS (left blue, right cyan) into 100k ohms with data sampled at 44.1kHz (20dB/vertical div.).
The magenta and red traces in fig.3 show the TEAC's wideband spectrum with 44.1kHz white noise data at –4dBFS and no upsampling. As is usually the case with a NOS DAC, the ultrasonic behavior comprises mirror-imaged versions of the audioband spectrum each side of the integer multiples of the baseband sample rate. The primary aliased images of a 19.1kHz tone at –3dBFS (cyan, blue) are barely suppressed, and there are higher-order aliased images present at low levels. Repeating this analysis with the 44.1kHz data upsampled to multibit delta sigma or DSD gave a better-behaved result. The result was very similar in both these modes. With the DSD low-pass Filter 1 engaged (fig.4), there is now a gentle rolloff above the audioband, and while the image at 25kHz of the 19.1kHz tone is only suppressed by 6dB, the other aliased images have almost completely disappeared. However, they reappear with DSD Filter 2 (fig.5).
Fig.6 TEAC UD-701N, digital inputs, upsampling off, frequency response at –12dBFS into 100k ohms with data sampled at: 44.1kHz (left channel green, right gray), 96kHz (left cyan, right magenta), and 192kHz (left blue, right red) (1dB/vertical div.).
Fig.7 TEAC UD-701N, digital inputs, DSD upsampling, frequency response at –12dBFS into 100k ohms with data sampled at: 44.1kHz (left channel green, right gray), 96kHz (left cyan, right magenta), and 192kHz (left blue, right red) (1dB/vertical div.).
FFig.8 TEAC UD-701N, digital inputs, spectrum with noise and spuriae of dithered 1kHz tone at –90dBFS with volume control set to the maximum (left blue, right red) and to “75” (left green, right gray) (20dB/vertical div.).
The frequency response with 44.1kHz, 96kHz, and 192kHz data without upsampling is flat in the audioband with a slow rolloff beginning below half of each sample rate (fig.6). With upsampling, the rolloff starts earlier. With 44.1kHz data upsampled to DSD or multibit delta sigma at 512kHz, for example (fig.7, green and gray traces), the response is down by 3dB at 19.5kHz. Channel separation was superb, at >115dB in both directions below 3kHz and still 107dB at the top of the audioand. With the volume control set to the maximum, the random noisefloor lay at the 16-bit level but dropped as the volume was lowered. With the control set to "75," the noisefloor dropped by 23dB, for example. The only supply-related spurious tone was at 120Hz; it lay at an insignificant –124dBFS even with the volume control set to "100."
Fig.9 TEAC UD-701N, digital inputs, upsampling modes, spectrum with noise and spuriae of dithered 1kHz tone at –90dBFS with 24-bit data (left blue, right red) (20dB/vertical div.).
Fig.10 TEAC UD-701N, digital inputs, upsampling modes, spectrum with noise and spuriae of dithered 1kHz tone at –120dBFS with 24-bit data (left blue, right red) (20dB/vertical div.).
Fig.11 TEAC UD-701N, digital inputs, multi-bit delta sigma upsampling, waveform of undithered 1kHz sinewave at –90.31dBFS, 16-bit data (left channel blue, right red)
When I examined the spectra with 16- and 24-bit dithered data representing a 1kHz tone at –90dBFS, the increase in bit depth didn't lower the noisefloor in any of the modes (fig.9), which suggests a measured resolution of 16 bits. There was also some noise modulation to each side of the tone and its low-order harmonics. However, when I repeated this test with dithered 24-bit data representing a 1kHz tone at –120dBFS, the harmonics and noise modulation disappeared, though the tone was reproduced 5dB too high in level (fig.10). When I played undithered data representing a tone at exactly –90.31dBFS, which consists of data at –1LSB, digital zero, and +1LSB, the waveform in all the modes was slightly asymmetrical (fig.11) and was overlaid with a higher level of random noise in DSD mode.
Fig.12 TEAC UD-701N, digital inputs, DSD upsampling, spectrum of 24-bit 50Hz sinewave, DC–1kHz, at 3V into 100k ohms (left channel blue, right red, linear frequency scale).
Fig.13 TEAC UD-701N, digital inputs, multi-bit delta sigma upsampling, spectrum of 24-bit 50Hz sinewave, DC–1kHz, at 3V into 100k ohms (left channel blue, right red, linear frequency scale).
With DSD upsampling, the TEAC's digital inputs produced primarily second-harmonic distortion (fig.12), this lying at –84dB (0.006%). When I repeated this analysis in multibit mode, the noisefloor was lower and the second harmonic was only slightly higher in level, but it was now accompanied by many higher-order harmonics, albeit at low levels (fig.13). These tests were performed with the balanced line output; repeating the spectral analyses at the same voltage from the balanced headphone and unbalanced headphone and line outputs and with a 1kHz signal, as well as 50Hz at –10dBFS gave similar results (not shown). On the positive side, the levels of the harmonics didn't increase into the punishing 600 ohm load, so perhaps they arise from the multibit upsampling algorithm.
Fig.14 TEAC UD-701N, digital inputs, multi-bit delta sigma upsampling, HF intermodulation spectrum, DC–30kHz, 19+20kHz at 0dBFS into 100k ohms, 24-bit, 44.1kHz data (left channel blue, right red; linear frequency scale).
Fig.15 TEAC UD-701N, digital inputs, DSD upsampling, HF intermodulation spectrum, DC–30kHz, 19+20kHz at 0dBFS into 100k ohms, 24-bit, 44.1kHz data (left channel blue, right red; linear frequency scale).
Intermodulation distortion with optical data representing an equal mix of 19 and 20kHz tones, each at –6dBFS, was relatively low in level, though a large number of aliasing products were present with multibit delta-sigma–upsampled data (fig.14). DSD upsampling behaved better in this respect (fig.15).
Fig.16 TEAC UD-701N, DSD upsampled 16-bit USB data, high-resolution jitter spectrum of analog output signal, 11.025kHz at –6dBFS, sampled at 44.1kHz with LSB toggled at 229Hz (left channel blue, right red). Center frequency of trace, 11.025kHz; frequency range, ±3.5kHz.
Fig.16 shows the spectrum of the UD-701N's output when it was fed 16-bit J-Test data via USB, upsampled to DSD. The odd-order harmonics of the undithered low-frequency, LSB-level squarewave lie at the correct levels, though there are some supply-related spuriae either side of the central spike that represents the high-level tone at one-quarter the sample rate (Fs/4). Peculiarly, the noisefloor was higher in level with 16-bit TosLink data, both with and without upsampling.—John Atkinson


