Though John Atkinson measured the Type Bs when they were delivered to Santa Fe, he refrained from giving me the data until after I'd finished the auditioning.
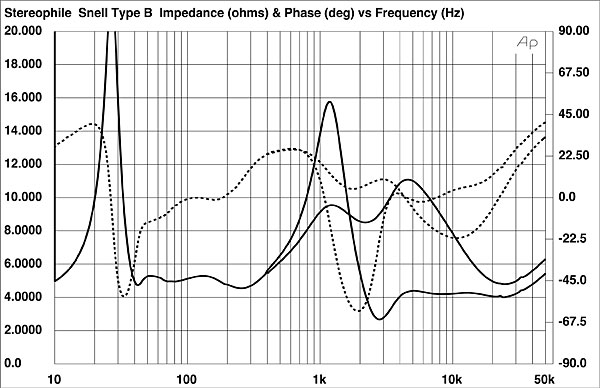
The B's impedance magnitude and phase angle with the rear tweeter on (which lowers the impedance above 8kHz) are shown in fig.1. The curve with the large peak at 1kHz is with the treble control at maximum, the flatter curve with it set at minimum. The minimum impedance was 2.7 ohms at 2.8kHz (tweeter level maximum) and 4.5 ohms at 250Hz (tweeter level at minimum). The impedance phase angle was fairly innocuous, suggesting that, its low impedance in the low treble aside, the Type B should present an easy load to a high-quality amplifier. The overall impedance, however, is slightly lower than average through the mid- and upper bass. The impedance peak at 27Hz—indicative of the sealed-box tuning—suggests the B will have deep LF extension.
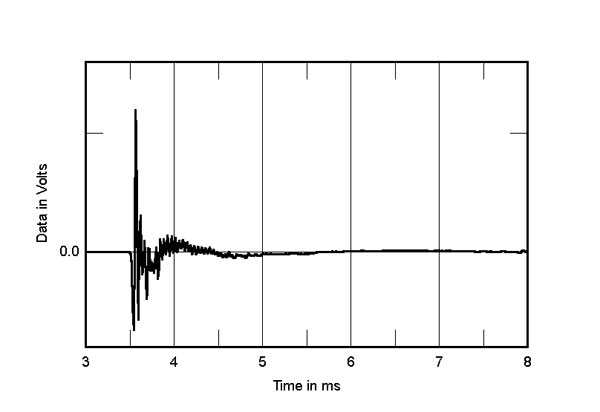
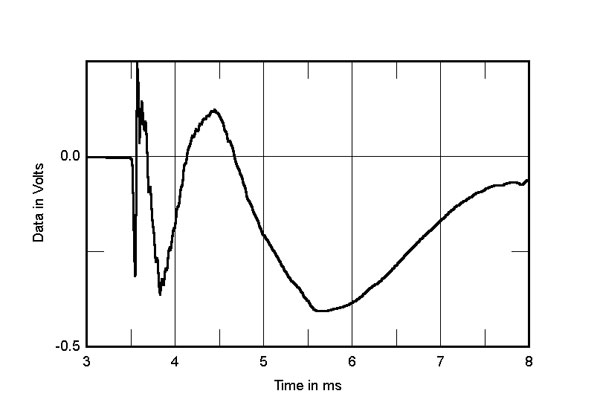
Looking at the B's impulse response (fig.2), the high-order crossover is apparent from the relatively slow decay, with higher-frequency ringing due to the tweeter. The step response (fig.3) indicates that all the front-firing drive-units are connected in inverted polarity.
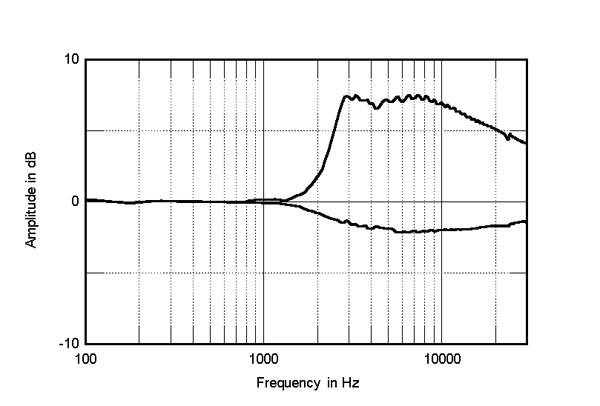
Moving from the time domain to the frequency domain, the Type B's anechoic response, averaged over a 30° lateral window, is shown to the right of fig.4. (The curve has been corrected for the measurement microphone's response.) The front woofer's nearfield response is the top curve on the left, and the rear subwoofer's nearfield response is the lower curve on the left. First, the overall balance is quite flat, especially looking at the treble in relation to the midrange. This correlates with my listening impressions. There is a slight bump and dip at about 1kHz, a characteristic that often correlates with some nasality, but both are very small. I doubt that this is the midrange anomaly I heard during the listening; the apparent anomaly I heard seemed much narrower in bandwidth. The rapid treble rise is beyond audibility.
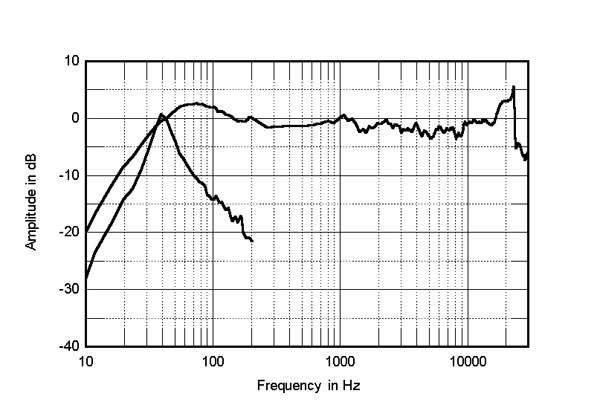
The front woofer's nearfield curve in fig.4 indicates good extension, perhaps with an overall rise in output between 50Hz and 100Hz, which again correlates with the listening impressions. The rear woofer tuning can be seen to have a much higher Q, with the driver's output centered on 40Hz. It is perhaps this narrowly tuned output that was being excited by kick drum on some recordings, leading to the feeling of excessive output.
Fig.5 shows the effect of the tweeter-level control, normalized to the response with it set to the 12 o'clock (flat) position. The top trace is with the level control at maximum, the bottom trace at minimum. This large treble boost and very little cut has reportedly been changed in later production to provide more cut, less boost, and greater sensitivity to changes in knob position.
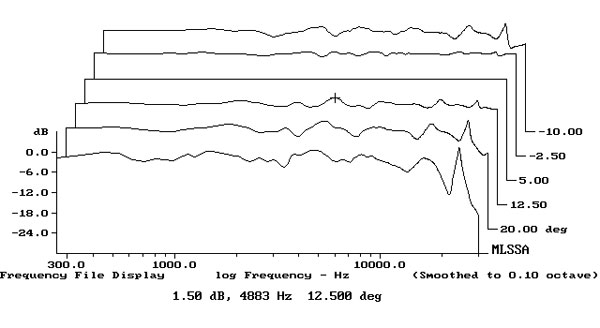
In fig.6, we can see the family of lateral response plots, measured on the tweeter axis at 45" and normalized to the tweeter axis response. These curves, therefore, assume the on-axis to be perfectly flat and just show the deviations from the on-axis response. The curves are, from top to bottom, 15° away from the midrange/tweeter side of the baffle; 7.5° away from the midrange/tweeter side; the reference flat on-axis response; 7.5° off-axis on the midrange/tweeter side of the baffle; and 15° off-axis on the midrange/tweeter side. The smoother curves on top reveal the B to be slightly flatter off-axis on the outside of the baffle rather than to the inside, which would suggest that the B should be toed-in toward the listener instead of pointing straight ahead. With the listener between the Bs pointed straight ahead, the upper mids and treble are a little more peaky. This was confirmed while experimenting with placement for the auditioning; I ended up with the speakers toed-in so that the listening chair was directly on-axis.
The vertical response family is shown in fig.7, again with the curves normalized to the response on the tweeter axis. The traces are, from top to bottom, level with the cabinet top, on the upper-midrange driver axis, the reference flat response, the lower-midrange axis, and on the woofer axis. These curves suggest the B's optimum listening axis is between the tweeter and lower midrange, exactly where my listening chair placed my ears.
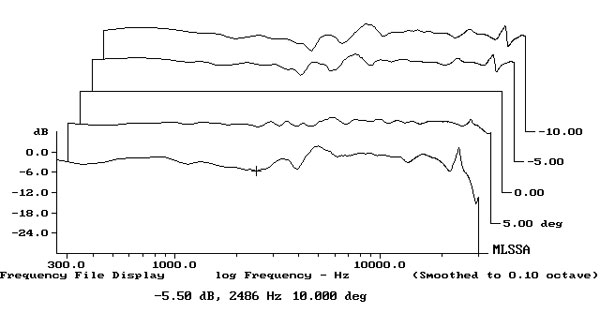
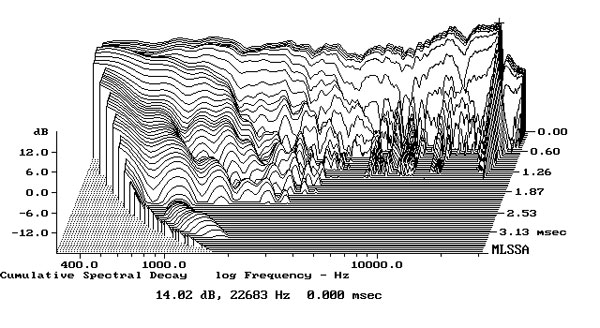
Fig.8 is the B's cumulative spectral decay, or waterfall, plot. It shows pretty good behavior, with a sudden decay and no major resonances in the audio band. Finally, driving the B with a variable sinewave oscillator revealed strong resonances at 27Hz and 43Hz. The cabinet was fairly inert until 200Hz, where it was again lively between 200Hz and 350Hz.—Robert Harley


