Sidebar 3: Measurements
I used DRA Labs' MLSSA system and a calibrated DPA 4006 microphone with an Earthworks microphone preamplifier to measure the Ruark Sabre-R's farfield frequency behavior and dispersion. I used an Earthworks QTC-40 mike for the nearfield responses and Dayton Audio's DATS V2 system to measure the impedance magnitude and electrical phase angle.
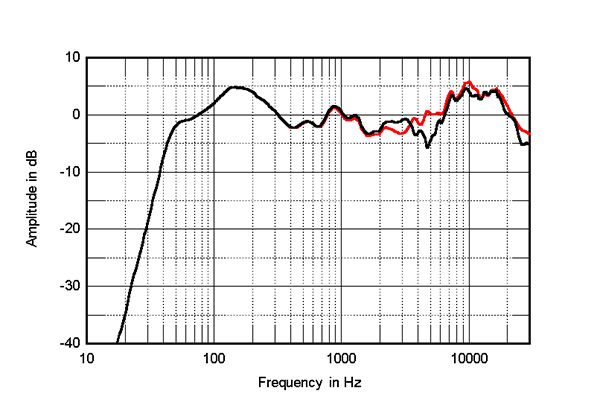
The black trace below 310Hz in fig.4 shows the complex sum of the woofer and port responses. The output starts to roll off below the upper-bass peak shown in fig.3 and is down by 20dB at 30Hz. The Ruark loudspeaker's low frequencies will benefit from it being placed close to the wall behind it.
It has been a long time since Stereophile reviewed a loudspeaker from British manufacturer Ruark. Wes Phillips reviewed the Templar tower in December 1995, and Kalman Rubinson reviewed the Equinox standmount in February 1997 (footnote 3). I was intrigued, therefore, by how a current-day Ruark speaker would measure. The Sabre-R's measured performance is somewhat idiosyncratic, but it reminded me of the kind of balance that was often preferred with small two-way speakers, with elevated bass and high treble regions—not unlike that of the classic LS3/5A, though somewhat exaggerated (footnote 4). The measurements also suggest that the Ruark's tonal balance could be optimized by experimenting with toe-in and the distance from the room's boundaries, as well as removing the grille.—John Atkinson
Footnote 1: EPDR is the resistive load that gives rise to the same peak dissipation in an amplifier's output devices as the loudspeaker. See "Audio Power Amplifiers for Loudspeaker Loads," JAES, Vol.42 No.9, September 1994, and stereophile.com/reference/707heavy/index.html. Footnote 2: This means that the loudspeaker is firing into hemispherical space rather than a full sphere. A speaker that has a truly flat response in the usual "4pi" space will therefore appear to have a boosted upper-bass output with a nearfield measurement, the center frequency of that boost depending on the physical dimensions of the speaker and the woofer alignment. See this explanation or aes2.org/publications/elibrary-page/?id=7171.
Footnote 3: You can read how the earlier Ruark speakers measured here and here.
Footnote 4: See fig.3 here.
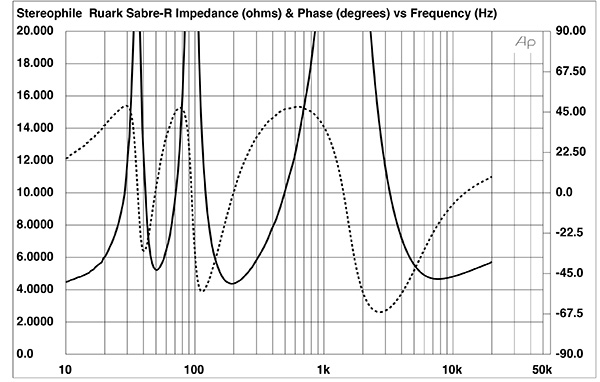
Fig.1 Ruark Sabre-R, electrical impedance (solid) and phase (dashed) (2 ohms/vertical div.).
Ruark specifies the Sabre-R's sensitivity as 86dB/2.823V/1m, which was confirmed by my B-weighted estimate. The Sabre-R's impedance is specified as 6 ohms. My measurement (fig.1, solid trace) indicated that the amplitude was higher than 6 ohms for most of the audioband, with a minimum value of 4.37 ohms at 193Hz. The impedance peak in the upper midrange and low treble is due to the crossover's low-pass and high-pass filters; these regions will be emphasized if the Sabre-R is used with a tube amplifier with a high source impedance. The electrical phase angle (dashed trace) is often high; the effective resistance, or EPDR (footnote 1), therefore drops below 3 ohms for several regions in the audioband, with minimum EPDR values of 2.63 ohms at 60Hz, 2.15 ohms at 150Hz, 2.4 ohms at 287Hz, and 1.84 ohms at 4.7kHz. Despite its specified 6 ohm impedance, the Sabre-R is a demanding load for the partnering amplifier.
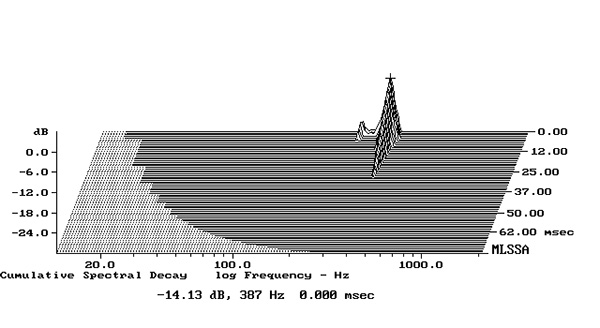
Fig.2 Ruark Sabre-R, cumulative spectral-decay plot calculated from output of accelerometer fastened to center of sidewall. (MLS driving voltage to speaker, 7.55V; measurement bandwidth, 2kHz).
The impedance traces are free from the small discontinuities that would imply the presence of panel resonances. When I investigated the Ruark enclosure's vibrational behavior with a plastic-tape accelerometer, I found a single resonant mode at 387Hz on all the loudspeaker's panels (fig.2). As this mode is low in level and has a high Q (Quality Factor), it is unlikely it will have audible consequences.
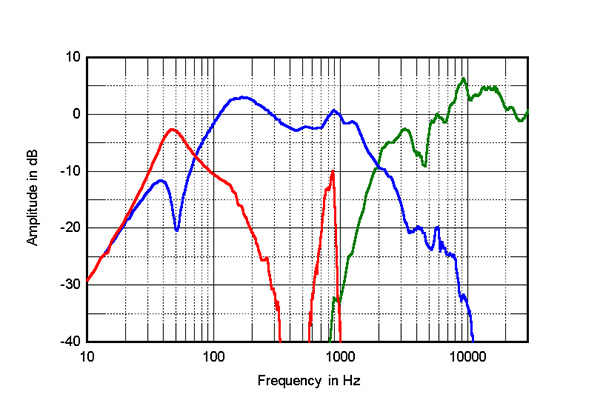
Fig.3 Ruark Sabre-R, acoustic crossover with grille on tweeter axis at 50", averaged across 30° horizontal window and corrected for microphone response, with the nearfield responses of the woofer (blue) and port (red) respectively plotted below 350Hz and 1kHz.
The saddle centered at 50Hz in the impedance magnitude trace in fig.1 suggests that this is the tuning frequency of the woofer's reflex loading. The blue trace below 350Hz in fig.3 shows the nearfield response of the woofer; there is the expected notch at the reflex tuning frequency, which is when the back pressure from the port resonance holds the driver's cone still. The port's nearfield response (red trace) peaks at the tuning frequency, and while its upper-frequency rolloff is rapid, there is a peak centered on 900Hz in its output. The 3dB rise in the woofer's upper-bass output is due to the nearfield measurement technique, which assumes that the drive units are mounted in a true infinite baffle (footnote 2).
Above 350Hz, the blue trace in fig.3 shows the woofer's farfield response on the tweeter axis. A small peak at 900Hz coincides with the peak in the port's output at that frequency. The woofer crosses over at the specified 2.2kHz to the tweeter (green trace), which has a small suckout in its output between 3.5kHz and 5kHz before peaking by 5dB in the top audio octave. The farfield traces in fig.3 were taken with the grille in place, as Ken Micallef told me that is how he preferred the Sabre-R's balance. The suckout was absent when I measured the tweeter's farfield response without the grille.
Fig.4 Ruark Sabre-R, anechoic response on tweeter axis at 50", averaged across 30° horizontal window and corrected for microphone response, with grille (black) and without grille (red), and the complex sum of the nearfield woofer and port responses plotted below 310Hz.
This can be seen in fig.4: The red trace above 310Hz shows the Sabre-R's quasi-anechoic farfield response, averaged across a 30° horizontal window centered on the tweeter axis, and taken without the grille; the black trace repeats this response measurement with the grille in place. This is identical to the response without the grille below 1kHz and above 12kHz, and in addition to the suckout, there is a slight boost in presence-region energy with the grille in place.
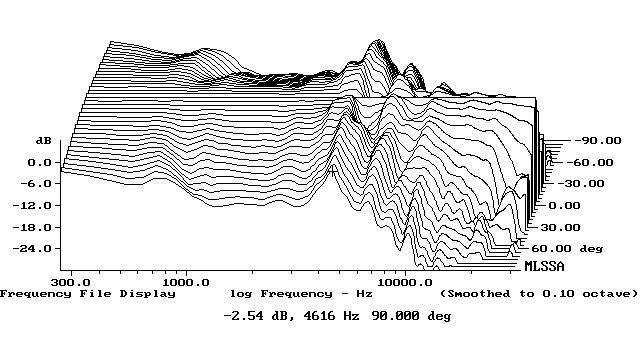
Fig.5 Ruark Sabre-R with grille, lateral response family at 50", normalized to response on tweeter axis, from back to front: differences in response 90–5° off axis, reference response, differences in response 5–90° off axis.
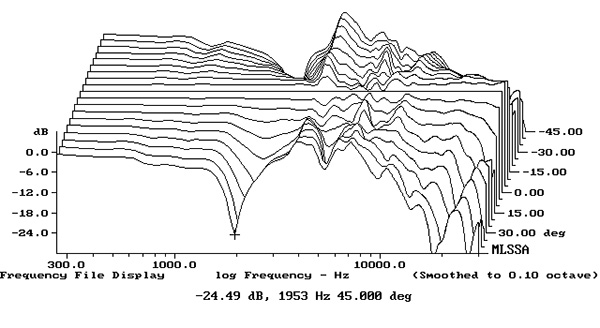
Fig.6 Ruark Sabre-R with grille, vertical response family at 50", normalized to response on tweeter axis, from back to front: differences in response 45–5° above axis, reference response, differences in response 5–45° below axis.
Fig.5 shows the Sabre-R's horizontal dispersion taken with the grille, normalized to the response on the tweeter axis, which thus appears as a straight line. The graph shows that the low- and mid-treble response evens out off-axis and that the top-octave boost in the tweeter's on-axis output is suppressed more than 15° to the speaker's sides. The Ruark speaker's radiation pattern in the vertical plane, again normalized to the response on the tweeter axis, is shown in fig.6. A sharply defined suckout in the crossover region develops more than 10° above and 20° below the tweeter axis.
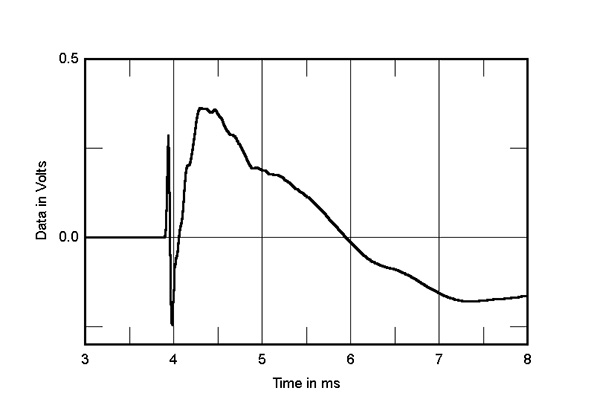
Fig.7 Ruark Sabre-R, step response without grille on tweeter axis at 50" (5ms time window, 30kHz bandwidth).
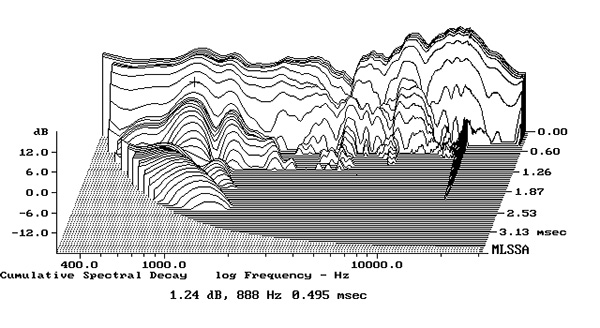
Fig.8 Ruark Sabre-R, cumulative spectral-decay plot with grille on tweeter axis at 50" (0.15ms risetime).
In the time domain, the Sabre-R's step response on the tweeter axis (fig.7) reveals that both drive units are connected in the same positive polarity. The decay of the tweeter's step smoothly blends with the start of the woofer's step, which suggests an optimal crossover topology. The Ruark's cumulative spectral-decay, or waterfall plot on the tweeter axis is shown in fig.8. It is generally clean, with a small ridge of delayed energy at the frequency of the peak in the port's output. (As always with my cumulative spectral-decay plots, ignore the ridge of delayed energy close to 16kHz, which is due to interference from the MLSSA host PC's video circuitry.)
Footnote 1: EPDR is the resistive load that gives rise to the same peak dissipation in an amplifier's output devices as the loudspeaker. See "Audio Power Amplifiers for Loudspeaker Loads," JAES, Vol.42 No.9, September 1994, and stereophile.com/reference/707heavy/index.html. Footnote 2: This means that the loudspeaker is firing into hemispherical space rather than a full sphere. A speaker that has a truly flat response in the usual "4pi" space will therefore appear to have a boosted upper-bass output with a nearfield measurement, the center frequency of that boost depending on the physical dimensions of the speaker and the woofer alignment. See this explanation or aes2.org/publications/elibrary-page/?id=7171.