Sidebar 3: Measurements
I used DRA Labs' MLSSA system, a calibrated DPA 4006 microphone, and an Earthworks microphone preamplifier to measure the Q Acoustics Concept 50's frequency response in the farfield. I used an Earthworks QTC-40 mike for the nearfield and in-room responses and Dayton Audio's DATS V2 system to measure the impedance magnitude and electrical phase angle.
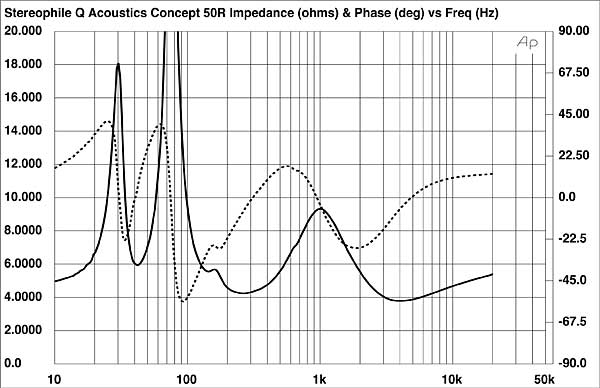
Q Acoustics specifies the Concept 50's anechoic sensitivity as 90.5dB/W/m. My estimate was somewhat lower, at 88.1dB/2.83V/m. The Concept 50's impedance is specified as 6 ohms, with a minimum value of 3.6 ohms. The impedance magnitude (fig.1. solid trace) varied between 6 ohms and 10 ohms over most of the audioband, with a minimum value of 3.79 ohms at 4kHz. The electrical phase angle (dotted trace) is generally benign, though it does reach –56° in the upper bass. Fortunately, the magnitude is high in this region, but the effective resistance, or EPDR (footnote 1), lies close to 3 ohms at 53Hz, between 96Hz and 262Hz, and between 1.6kHz and 4kHz, with a minimum value of 2.18 ohms at 2.58kHz. As long as the partnering amplifier is comfortable driving 4 ohms, the Concept 50 won't present it with any drive problems.
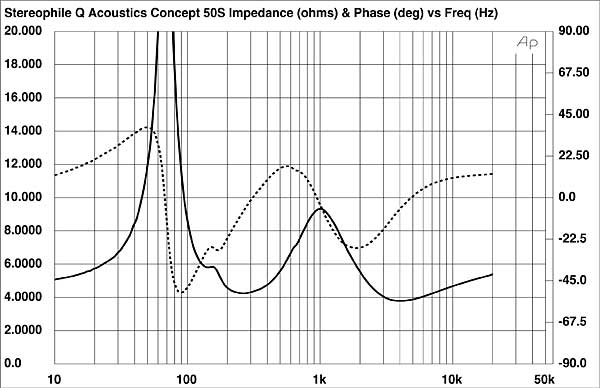
 The saddle at 42Hz reveals that this is the tuning frequency of the port on the rear panel. With this port sealed with the supplied foam plug, the impedance traces (fig.2) are typical of a sealed enclosure tuned to a relatively high 70Hz.
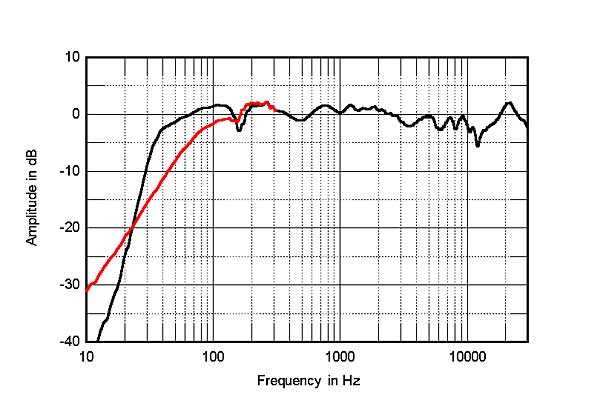
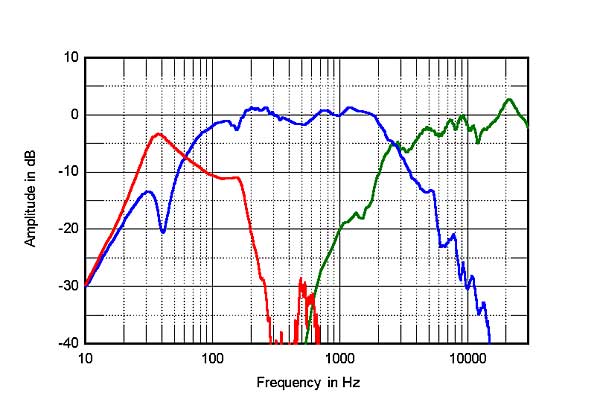 The complex sum of the woofer and port responses is shown as the black trace below 300Hz in fig.5. There is little sign of the usual peak in the midbass region that will be due to the nearfield measurement technique, which assumes that the drive units are mounted in a true infinite baffle, ie, one that extends to infinity in both planes. The woofers' reflex alignment is therefore overdamped, which implies that the speaker will give the highest low-frequency output when it is placed relatively close to the wall behind it. The suckout at 162Hz is present but is less well-developed when the port is blocked (red trace).
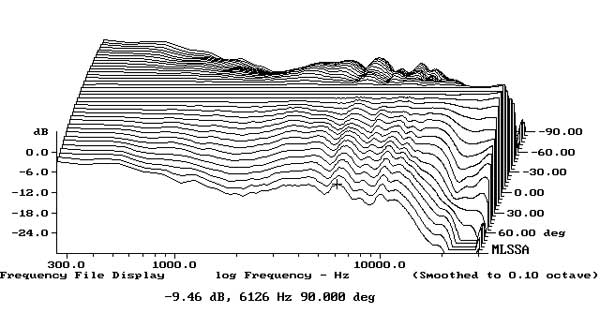
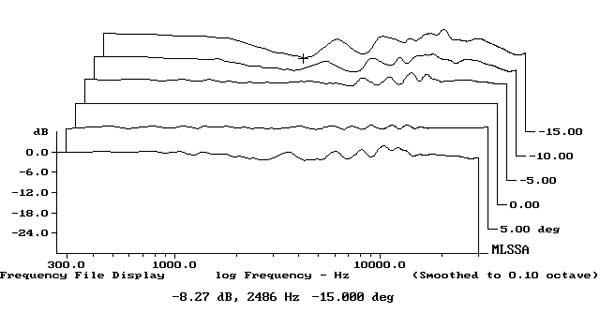
 >Fig.6 shows the Concept 50's horizontal dispersion, normalized to the response on the tweeter axis, which thus appears as a straight line. The contour lines in this graph are even, though there is slightly greater mid-treble output to the speaker's sides, which will tend to compensate for the lack of energy in the same region in the on-axis output. Fig.7 shows the speaker's dispersion in the vertical plane. The tweeter-axis response is maintained over a wide ±10° window, and the hint of a suckout in the crossover region doesn't develop until 15° above the reference axis.
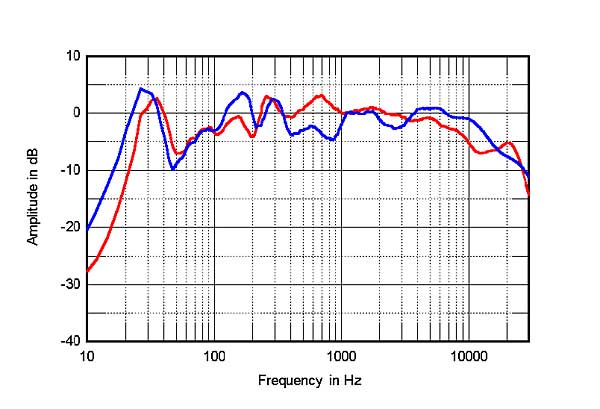
 The red trace in fig.8 shows the Q Acoustics Concept 50's spatially averaged response (footnote 3) in my room with their ports open. The response is reasonably even from 300Hz to 3kHz, though with a slight excess of energy in the upper midrange. There is insufficient upper- and midbass energy due to the fact that I wasn't able to move the speakers as close to the wall behind them as necessary. The response gently slopes down in textbook fashion above 3kHz, due to the increased absorption of the room's furnishings as the frequency increases. For reference, the blue trace in fig.8 shows the spatially averaged response of the Bowers & Wilkins 804 D4s, which I reviewed in January 2022. The B&Ws have too much mid- and high-treble energy in-room compared with the Q Acoustics speakers and have a less-even midrange. They also excite the lowest-frequency mode in my room to a slightly greater extent.
Footnote 1: EPDR is the resistive load that gives rise to the same peak dissipation in an amplifier's output devices as the loudspeaker. See "Audio Power Amplifiers for Loudspeaker Loads," JAES, Vol.42 No.9, September 1994, and stereophile.com/reference/707heavy/index.html. Footnote 2: My measured response of the Concept 50 is very similar to that performed by Paul Miller for Stereophile's sister magazine Hi-Fi News. See hifinews.com/content/q-acoustics-concept-50-loudspeaker-lab-report. Footnote 3: Using the FuzzMeasure 3.0 program, a Metric Halo MIO2882 FireWire-connected audio interface, and a 96kHz sample rate, I average 20 1/6-octave–smoothed spectra, individually taken for the left and right speakers, in a rectangular grid 36" wide by 18" high and centered on the positions of my ears.
Fig.1 Q Acoustics Concept 50, electrical impedance (solid) and phase (dashed) with port open (2 ohms/vertical div.).
Fig.2 Q Acoustics Concept 50, electrical impedance (solid) and phase (dashed) with port closed (2 ohms/vertical div.).
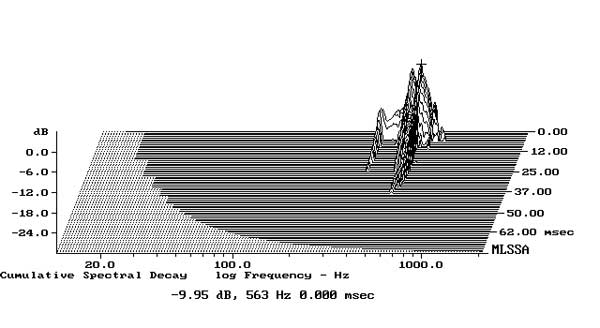
There is an unusual peak centered on 162Hz in the magnitude traces in figs.1 and 2 as well as the hint of a discontinuity around 600Hz. When I investigated the enclosure's vibrational behavior with a plastic-tape accelerometer, I didn't find anything at 162Hz, but a pair of resonant modes between 500Hz and 600Hz was present on all the panels (fig.3). These modes are both relatively low in level and sufficiently high in frequency that they should not have audible consequences.
Fig.3 Q Acoustics Concept 50, cumulative spectral-decay plot calculated from output of accelerometer fastened to center of front baffle below drive-units (MLS driving voltage to speaker, 7.55V; measurement bandwidth, 2kHz).
The red trace in fig.4 shows the response of the port, measured in the nearfield. The output peaks just below the tuning frequency, and the upper-frequency rollout is disturbed by what appears to be a peak at 162Hz. The peak coincides with a suckout at the same frequency in the woofers' nearfield output (blue trace; both woofers behave identically). The woofers' response is otherwise reasonably even before it crosses over to that of the tweeter just below 3kHz. This frequency is higher than the specified 2.1kHz, which may be due to the fact that the tweeter's average level is a couple of dB lower than that of the woofer.
Fig.4 Q Acoustics Concept 50, acoustic crossover on tweeter axis at 50", corrected for microphone response, with the nearfield response of woofers (blue) and port (red), respectively plotted below 350Hz and 680Hz.
Fig.5 Q Acoustics Concept 50, anechoic response on tweeter axis at 50", averaged across 30° horizontal window and corrected for microphone response, with the complex sum of the nearfield woofer and port responses (black) and the nearfield sealed-box woofer response (red), both plotted below 300Hz.
The black trace above 300Hz in fig.5 shows the Concept 50's quasi-anechoic farfield response, averaged across a 30° horizontal window centered on the tweeter axis. Again, although the response is relatively even in the midrange and low treble, the output in the region covered by the tweeter is shelved down (footnote 2). I suspect that this is the reason my estimated sensitivity was lower than the specified figure. The pair matching between the two samples was excellent, however, the difference in farfield response falling within ±0.25dB limits from 800Hz to 8kHz. The trace in fig.5 was taken without the grille. The response with the grille (not shown) reduced the level between 3.5kHz and 11kHz by up to 3dB at some frequencies.
Fig.6 Q Acoustics Concept 50, lateral response family at 50", normalized to response on tweeter axis, from back to front: differences in response 90–5° off axis, reference response, differences in response 5–90° off axis.
Fig.7 Q Acoustics Concept 50, vertical response family at 50", normalized to response on tweeter axis, from back to front: differences in response 15–5° above axis, reference response, differences in response 5–10° below axis.
Fig.8 Q Acoustics Concept 50, spatially averaged, 1/6-octave response in JA's listening room (red), and of the Bowers & Wilkins 804 D4 (blue).
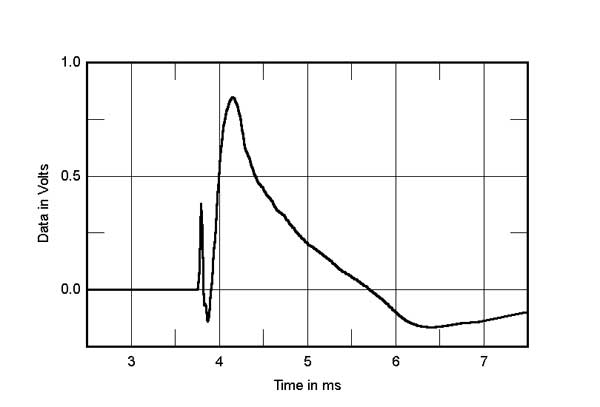
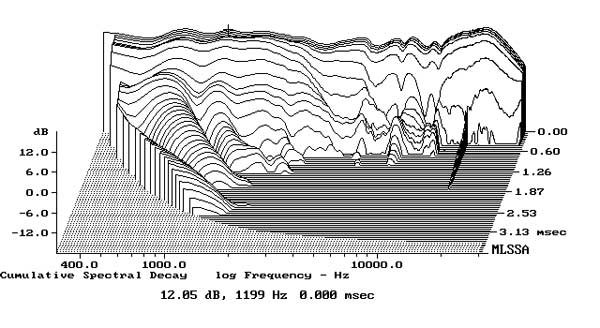
In the time domain, the Concept 50's step response (fig.9) indicates that all three drive units are connected in positive acoustic polarity. The decay of the tweeter's step, which arrives first at the microphone, smoothly blends with the start of the woofers' step, which implies optimal crossover implementation. The Concept 50's cumulative spectral-decay plot on the tweeter axis (fig.10) is superbly clean.
Fig.9 Q Acoustics Concept 50, step response on tweeter axis at 50" (5ms time window, 30kHz bandwidth).
Fig.10 Q Acoustics Concept 50, cumulative spectral-decay plot on tweeter axis at 50" (0.15ms risetime).
The Q Acoustics Concept 50's measured performance is indicative of excellent audio engineering.—John Atkinson
Footnote 1: EPDR is the resistive load that gives rise to the same peak dissipation in an amplifier's output devices as the loudspeaker. See "Audio Power Amplifiers for Loudspeaker Loads," JAES, Vol.42 No.9, September 1994, and stereophile.com/reference/707heavy/index.html. Footnote 2: My measured response of the Concept 50 is very similar to that performed by Paul Miller for Stereophile's sister magazine Hi-Fi News. See hifinews.com/content/q-acoustics-concept-50-loudspeaker-lab-report. Footnote 3: Using the FuzzMeasure 3.0 program, a Metric Halo MIO2882 FireWire-connected audio interface, and a 96kHz sample rate, I average 20 1/6-octave–smoothed spectra, individually taken for the left and right speakers, in a rectangular grid 36" wide by 18" high and centered on the positions of my ears.


