| Columns Retired Columns & Blogs |
PS Audio GCC-100 integrated amplifier Measurements
Sidebar 3: Measurements
Footnote 1: My thanks to PS Audio's Paul McGowan for the loan of this filter.— John Atkinson
As set up, the sample of the PS Audio GCC-100 I was sent for measurement had a maximum gain of 42dB into 8 ohms for both balanced and unbalanced input signals. Both inputs were noninverting (ie, preserved absolute polarity), the XLR jacks apparently wired with pin 2 hot. The unbalanced input impedance was a high 50k ohms over most of the audioband, dropping slightly but inconsequentially to 32k ohms at 20kHz. The balanced input impedance was 100k ohms across the band.
The output impedance was a moderately low 0.15 ohm at low and midrange frequencies. Peculiarly, I couldn't get a sensible reading at 20kHz, the amplifier giving a lower output voltage when unloaded. Perhaps this had something to do with the amplifier's output filter, which causes the frequency response to peak a little above the audioband (fig.1). Into lower impedances, the GCC-100's output starts to roll off at increasingly lower frequencies, in the worst case into 2 ohms, resulting in an output down 0.75dB at 20kHz. Into 8 ohms, the response didn't reach its –3dB point until 82kHz.
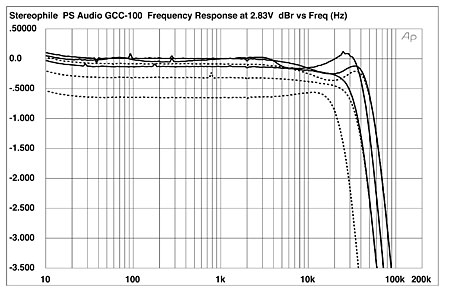
Fig.1 PS Audio GCC-100, unbalanced frequency response at 2.83V into (from top to bottom at 2kHz): simulated loudspeaker load, 8, 4, 2 ohms (0.5dB/vertical div., right channel dashed).
Amplifiers with switching output stages produce high levels of ultrasonic noise, which is why a low-pass filter is necessary between the output stage and the speaker terminals. Even with this filter, however, and no signal, the GCC-100 had 856mV of ultrasonic noise present on its output. This noise can be seen obscuring the shape of a 1kHz squarewave (fig.2). Inserting an Audio Precision low-pass filter (footnote 1) between the amplifier and my System One analyzer, which Audio Precision recommends to avoid the analyzer's input slew-rate limiting, eliminated the noise and revealed a small degree of well-damped overshoot (fig.3), this correlating with the small response peak seen at 33kHz with the amplifier driving 8 ohms.
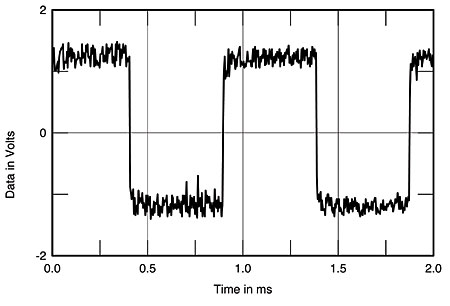
Fig.2 PS Audio GCC-100, small-signal 1kHz squarewave into 8 ohms.
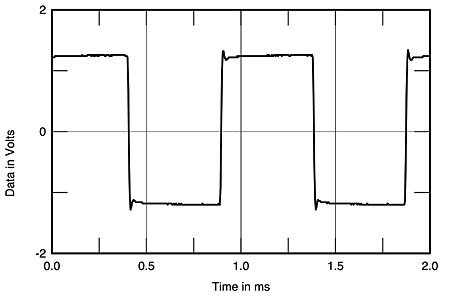
Fig.3 PS Audio GCC-100, small-signal 1kHz squarewave into 8 ohms with Audio Precision low-pass filter.
Figs.4 and 5 show a similar pair of waveform traces, this time with the amplifier reproducing a 10kHz squarewave into 8 ohms. If you count the sinewaves lying atop one cycle of the 10kHz wave in fig.4, there are 40, suggesting that the PS Audio's output stage is operating at a switching frequency of 400kHz with this audio signal (401.8kHz, clarified my System One's frequency display).
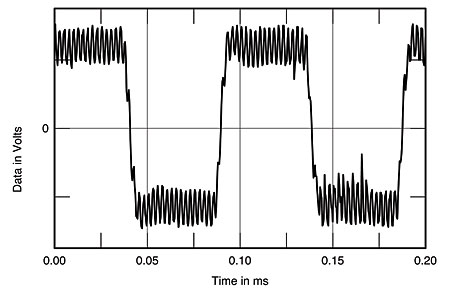
Fig.4 PS Audio GCC-100, small-signal 10kHz squarewave into 8 ohms.
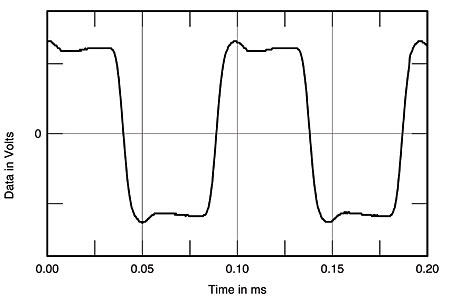
Fig.5 PS Audio GCC-100, small-signal 10kHz squarewave into 8 ohms; with Audio Precision low-pass filter.
This ultrasonic content made a nonsense of the measurements of wideband crosstalk and signal/noise ratio. I therefore used the Audio Precision filter to assess the GCC-100's audioband channel separation. Any crosstalk was below –100dB in the low treble and below (fig.6), which is excellent. The noise degraded a wideband S/N measurement to just 10.9dB (ref. 1W into 8 ohms with the input shorted to ground and the volume control at its maximum). Restricting the measurement bandwidth increased the S/N ratio to a respectable 67.9dB; switching in an A-weighting filter improved the ratio further, to 71.1dB.
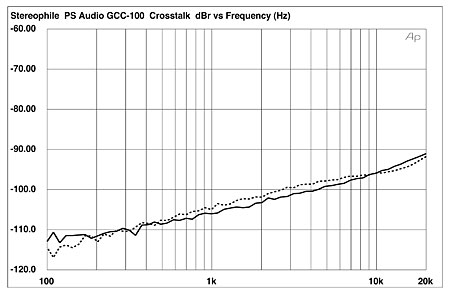
Fig.6 PS Audio GCC-100, channel separation; with Audio Precision low-pass filter (10dB/vertical div., R–L dashed).
I kept the Audio Precision low-pass filter in circuit to assess the GCC-100's maximum output level. Fig.7 plots the percentage of audioband THD+noise present in the amplifier's output against power with both channels driven: taking the 1% THD+N point as clipping, the PS Audio exceeds its specified power of 100W into 8 ohms (20dBW), giving out 120W into 8 ohms (20.8dBW), 225W into 4 ohms (20.5dBW), and 305W into 2 ohms (18.8dBW, only one channel driven).
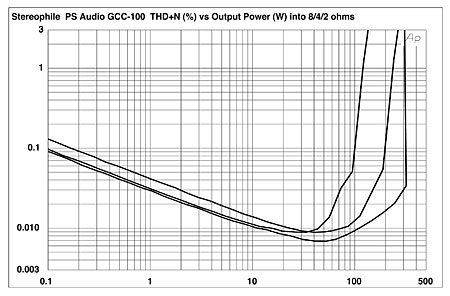
Fig.7 PS Audio GCC-100, distortion (%)vs 1kHz continuous output power into (from bottom to top at 1W): 8, 4, 2 ohms; with Audio Precision low-pass filter.
The downward slope with increasing frequency below 50W of the traces in fig.7 suggests that below that power level, the measured THD+N is dominated by noise rather than distortion, even with the AP filter removing the ultrasonic content. I therefore measured how the THD+N percentage changed with frequency at a higher-than-usual level, 17.5V RMS, this equivalent to a power of 38.3W into 8 ohms. (All the following measurements were taken with the Audio Precision low-pass filter in-circuit.) The results are shown in fig.8. Below 2kHz, the GCC-100's left channel (solid trace) offers very low distortion into 8 and 4 ohms, and not much more into 2 ohms. Above that frequency the THD rises significantly, presumably due to the decreasing effectiveness of negative feedback. Below 4kHz, the right channel (dashed trace) is a little less linear into 8 ohms and considerably less so into 4 ohms (I didn't measure that channel into 2 ohms), but is identical to the left channel above that frequency into both loads.
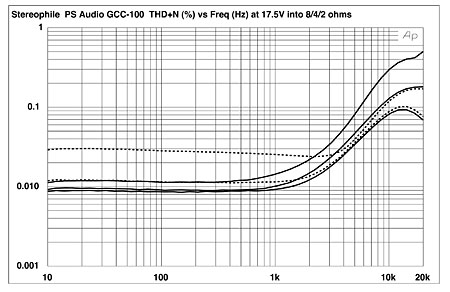
Fig.8 PS Audio GCC-100, THD+N (%)vs frequency at 17.5V into (from bottom to top): 8, 4, 2 ohms; with Audio Precision low-pass filter (right channel dashed).
The audibility of distortion, of course, depends not so much on level but on its spectral content, and in that respect the GCC-100 did well. The bottom trace in fig.9 shows the waveform of the left channel's THD+N residual with the amplifier driving a 1kHz tone at 40W into 4 ohms. I averaged 32 readings to drop the contribution of the noise by, in theory, 15dB, but even so, the only harmonic that can be seen is the subjectively innocuous third. Fig.10 shows an FFT-derived spectrum of the PS Audio's output while it drove a 50Hz tone at 100W into 4 ohms. The third harmonic lies at –84dB (0.006%), with the second the only other harmonic visible above –100dB. No trace of the 60Hz or 120Hz power-supply frequencies can be seen, which is commendable. Intermodulation distortion is similarly low in level, even at high frequencies and high powers (fig.11).
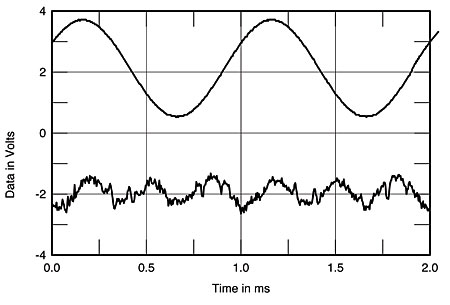
Fig.9 PS Audio GCC-100, 1kHz waveform at 40W into 4 ohms (top), 0.00885% THD+N; distortion and noise waveform with fundamental notched out (bottom, not to scale); with Audio Precision low-pass filter.
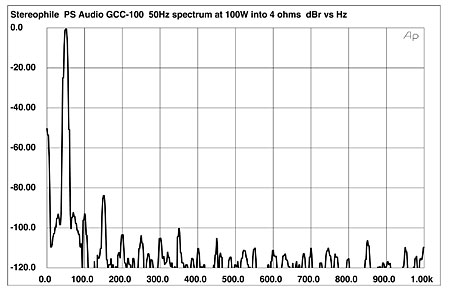
Fig.10 PS Audio GCC-100, spectrum of 50Hz sinewave, DC–1kHz, at 100W into 4 ohms (linear frequency scale); with Audio Precision low-pass filter.
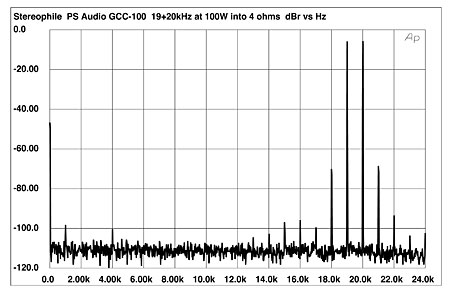
Fig.11 PS Audio GCC-100, HF intermodulation spectrum, DC–24kHz, 19+20kHz at 100W peak into 4 ohms (linear frequency scale); with Audio Precision low-pass filter.
Overall, the PS Audio GCC-100 offers respectable measured performance, particularly compared with its three-year-old sibling, the HCA-2, which I write about in this issue's Follow-Up section.— John Atkinson
Footnote 1: My thanks to PS Audio's Paul McGowan for the loan of this filter.— John Atkinson
- Log in or register to post comments
