| Columns Retired Columns & Blogs |
Nagra PL-L preamplifier Measurements
Sidebar 3: Measurements
The Nagra PL-L preserved absolute polarity for both unbalanced and balanced signals, its XLRs appearing to be wired with pin 2 hot, the AES/IEC standard. Its input impedance at 1kHz was lower than specified, at 29k ohms, though this will not be a problem. The maximum voltage gain into 100k ohms was 12dB from both sets of outputs, as indicated on the volume control. The calibration of the modulometer was accurate, an indicated "0dB" indeed giving unity gain. The unbalanced output impedance was 36 ohms across most of the audioband, this increasing slightly to 125 ohms at 20Hz. The balanced figures, from the optional transformer-coupled XLR output, were 63 ohms at 1kHz, 66 ohms at 20kHz, and 158 ohms at 20kHz.
The increase in source impedance at low frequencies gives rise to a slight rolloff when the PL-L is used to feed very low impedances; for example, the -3dB point into 600 ohms lies at 11Hz (fig.1). The ultrasonic response is sensibly rolled off by 1dB at 79kHz from the single-ended outputs and a little earlier from the balanced, at 33kHz, which results in a slight droop of -0.75dB at 20kHz. Note the 0.25dB channel imbalance in fig.1. I had used the balance control and the modulometer to equalize the channel levels at the unity-gain setting of the volume control. The imbalance crept in when the volume was set to its +12dB position, as it was for this graph.
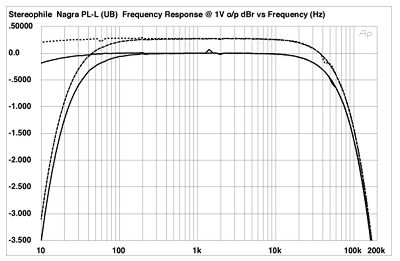
Fig.1 Nagra PL-L, unbalanced frequency response into 100k ohms (top) and 600 ohms (bottom), with volume control at maximum (0.5dB/vertical div.).
The A-weighted signal/noise ratio, ref. 1V output and taken with the unbalanced input shorted and the volume control set to +12dB, was superb at 97dB. The unweighted audioband ratio was almost identical at 97dB, though increasing the measurement bandwidth to 500kHz worsened the figure to 67.5dB. Channel separation (fig.2) showed a uniform decrease with increasing frequency, presumably due to capacitive coupling. The crosstalk is still -50dB at 20kHz, so this should not have audible consequences.
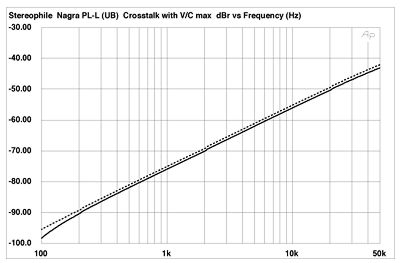
Fig.2 Nagra PL-L, unbalanced channel separation (R-L dashed, 10dB/vertical div.).
The downward slope of the THD+noise trace with increasing frequency (fig.3) shows that the Nagra's distortion is below its noise floor at less than 2V output into higher impedances. With clipping defined as 1% THD, the PL-L could deliver 6V into 100k ohms and 5.5V into 10k ohms, both figures more than adequate to drive real-world amplifiers to their maximum power. (The balanced outputs were identical in this respect.) Fig.3 reveals that the PL-L is working hard into 1k ohm, with an earlier increase in THD and a reduced clipping level of 2.8V. This load is unlikely to be encountered in domestic systems, but fig.3 does suggest that the PL-L not be used to drive "professional" 600 ohm loads.
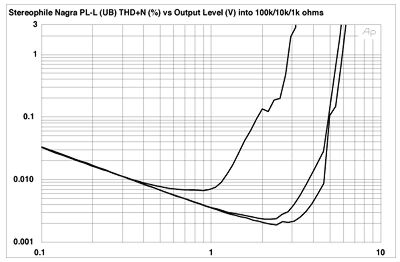
Fig.3 Nagra PL-L, distortion (%) vs unbalanced output voltage into (from right to left at 3%): 100k, 10k, and 1k ohms.
Fig.4 plots the THD+N percentage against frequency at an output level of 2V, where fig.3 had suggested that the PL-L's distortion was starting to emerge from the noise floor. The unbalanced behavior (bottom traces) is superb, with only small rises apparent above and below the audioband. The balanced traces (top) are very slightly worse than the unbalanced over most of the band, but a greater rise in the measured percentage can be seen below 25Hz, presumably due to the onset of core saturation in the balancing transformer. At just 0.1% at 10Hz, however, this behavior will not be audible.
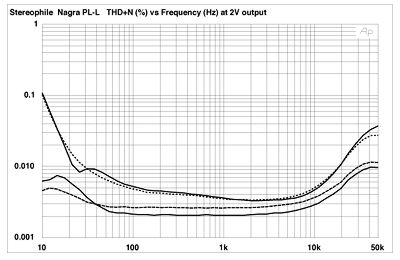
Fig.4 Nagra PL-L, THD+noise (%) vs frequency at 2V into 100k ohms: balanced (top), unbalanced (bottom) (right channel dashed).
Fig.5, taken at 1V into 8k ohms, shows the spectrum of the PL-L's unbalanced output signal. The second harmonic is the highest in level, if the word "high" is even appropriate for something at -97dB (0.0014%), with any higher harmonics at -116dB or below. Reducing the load to 1k ohms makes the preamp work much harder, as expected from fig.3. The sum of the harmonics rises from 0.0014% to 0.009%, and, as fig.6 shows, not only have the second through fourth harmonics all risen significantly in level (particularly the third), but they are now joined by some higher-order spuriae. Again, the Nagra's superb linearity will be achieved only into higher impedances.
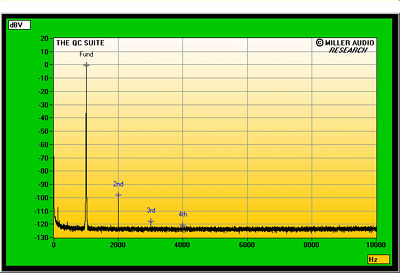
Fig.5 Nagra PL-L, spectrum of unbalanced 1kHz sinewave, DC-10kHz, at 1V into 8k ohms (linear frequency scale, 10dB/vertical div.).
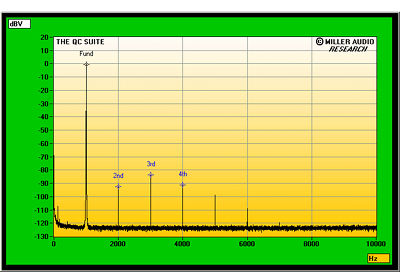
Fig.6 Nagra PL-L, spectrum of unbalanced 1kHz sinewave, DC-10kHz, at 1V into 1k ohms (linear frequency scale, 10dB/vertical div.).
Finally, fig.7 reveals that, even into 1k ohms, the PL-L has very low levels of intermodulation distortion, the 1kHz difference product from the full-scale mix of 19kHz and 20kHz tones lying at -90dB. Increasing the load to 8k ohms (not shown) drops the 1kHz product to -94dB (0.002%), while the higher-order components at 18kHz and 21kHz fall to -100dB.
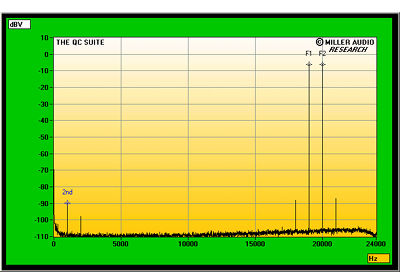
Fig.7 Nagra PL-L, unbalanced HF intermodulation spectrum, DC-24kHz, 19+20kHz at 1V into 1k ohms (linear frequency scale).
Overall, this is superb measured performance. While the PL-L should not be used into impedances much below 8k ohms, thus ruling out professional 600 ohm loads, the gain structure and overload behavior are sensibly arranged with the expected audiophile usage in mind. Another Swiss jewel of a product from Nagra.—John Atkinson
- Log in or register to post comments
