I examined the measured behavior of the Musical Fidelity V90-DAC with my Audio Precision SYS2722 system (see www.ap.com and the January 2008 "As We See It"). For some tests, and to check the results of others with a different measurement system, I used my vintage Audio Precision System One DSP. My sample of the V90-DAC was serial number "RRY0135 (JUNE 2013)."
I used my 2012-vintage Apple MacBook Pro, running on battery power, to examine the V90-DAC's performance via its USB port. Apple's USB Prober utility identified the Musical Fidelity as having the manufacturer string "Musical Fidelity" and the product string "Musical Fidelity V90-DAC 24/96." USB Prober confirmed that the processor operated in the preferred isochronous asynchronous mode, and that V90-DAC would accept 16- and 24-bit data at sample rates of 44.1, 48, 88.2, and 96kHz. The coaxial S/PDIF input locked to datastreams with sample rates ranging from 32 to 192kHz. The optical TosLink input was restricted to sample rates of 96kHz and below.
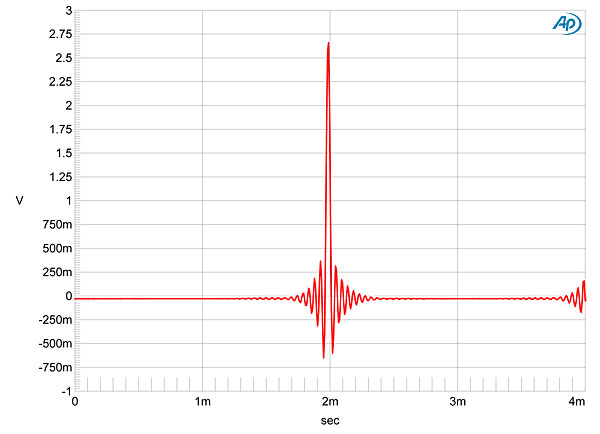
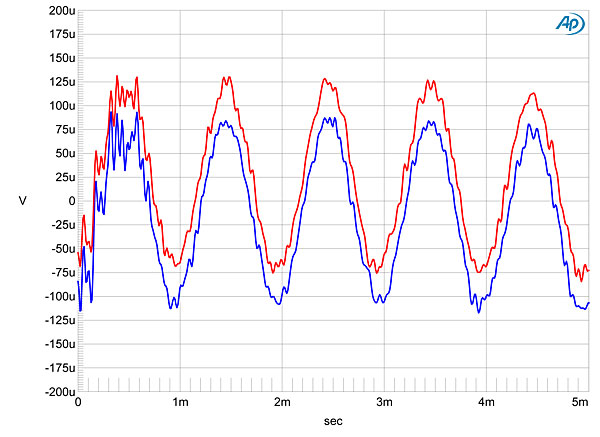
The V90-DAC preserved absolute polarity, and its maximum output level at 1kHz was 2.18V, or 0.73dB higher than the CD standard's 2V. The output impedance was low, at 99 ohms at high and middle frequencies, rising to a still-low 124 ohms at 20Hz, but these values are all higher than the specified 47 ohms. The impulse response with 44.1kHz data (fig.1) was usual for a digital FIR reconstruction filter, with symmetrical "ringing" either side of the impulse.
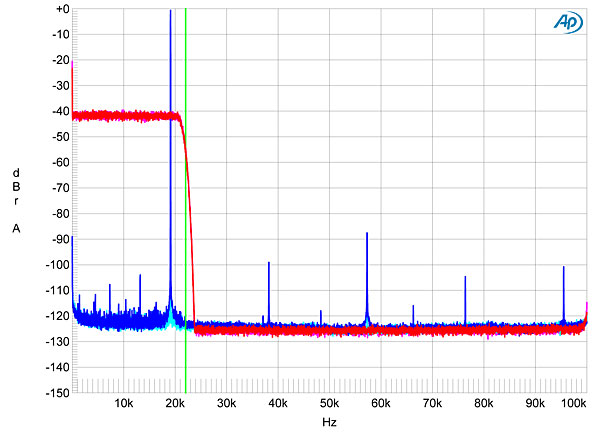
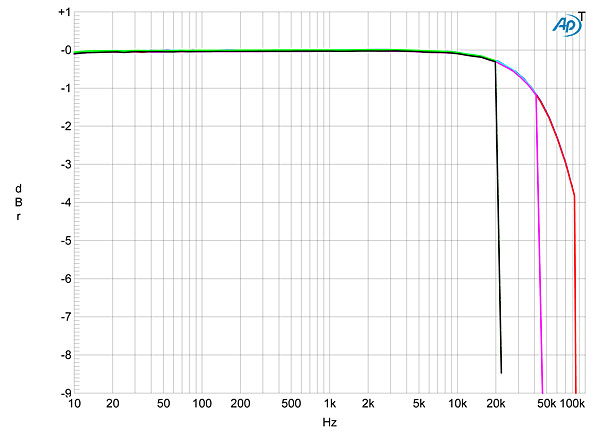
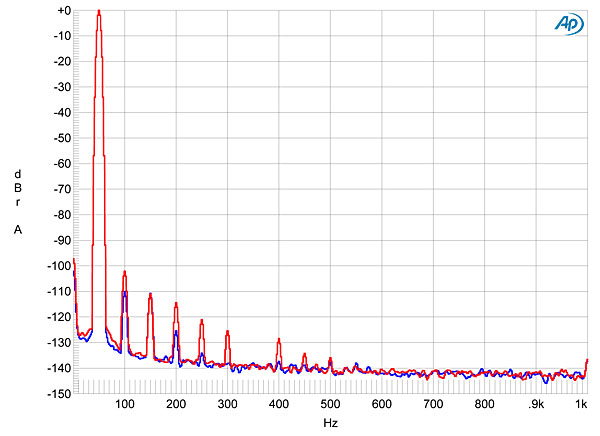
The magenta and red traces in fig.2 reveal that this filter rolls off the output sharply above the audioband with 44.1kHz data, but doesn't reach full attenuation until a little higher than the Nyquist frequency (half the sample rate), indicated in this graph by a vertical green line. However, the 25kHz aliasing image of a full-scale tone at 19.1kHz (cyan and blue traces) is completely suppressed by the filter. The harmonics of this tone are all low in level, with the third harmonic, at 57.3kHz, the highest in level, at –87dB (0.014%). Fig.3 shows a more conventional plot of frequency response, taken at 44.kHz (green and gray traces), 96kHz (cyan, magenta), and 192kHz (blue, red). With each sample rate, the high-frequency rolloff follows the same shape: a gentle rolloff starting in the top audio octave, broken by a sharp cutoff just below the Nyquist frequency. With 192kHz data, the response is down by 3dB at 70kHz. Note the superb channel matching in this graph.
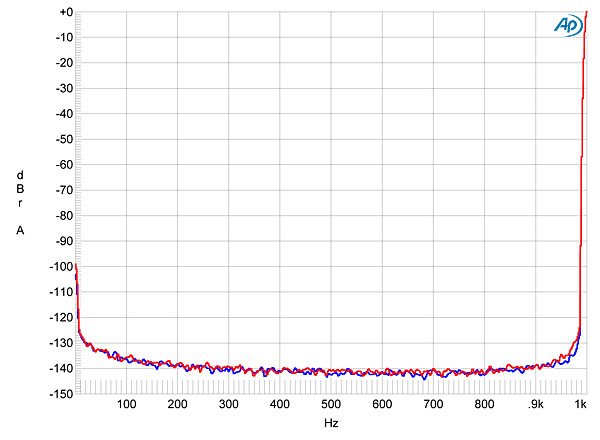
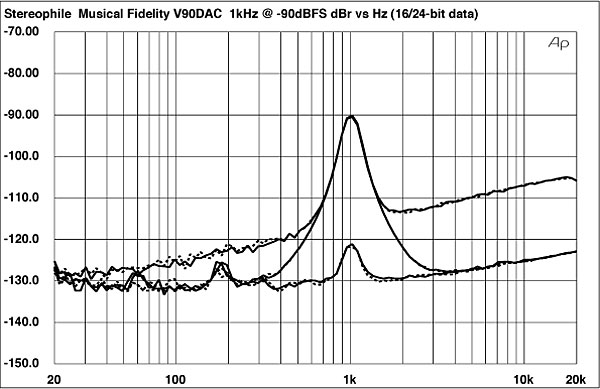
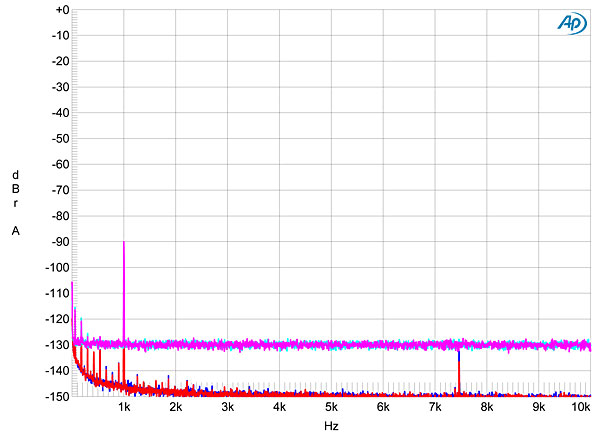
Channel separation (not shown) was superb, at 115dB (R–L) and 125dB (L–R) in the midrange, these decreasing to a still-excellent 100dB in both directions in the bass, presumably due to increasing power-supply impedance in this region. The low-frequency noise floor while the V90-DAC decoded data representing a full-scale 1kHz tone (fig.4) was clean, and free from any power-supply artifacts. Of course, this is what should be expected from the V90-DAC's use of a switch-mode supply. But peculiarly, when I tested the Musical Fidelity's resolution with the legacy technique of sweeping a 1/3-octave bandpass filter from 20kHz down to 20Hz while the DAC decoded dithered data representing a 1kHz tone at –90 and –120dBFS, a small peak could be seen at 180Hz with 24-bit data (fig.5, bottom traces). With 16-bit data, all that can be seen in the graph is the spectrum of the dither noise (top pair of traces); but with 24-bit data, the noise floor dropped by almost 18dB, which implies intrinsic resolution of 19 bits or so. This was confirmed by FFT analysis (fig.6). This graph, however, reveals a low-level tone at 7.4kHz with 24-bit data, presumably an idle tone of some kind.
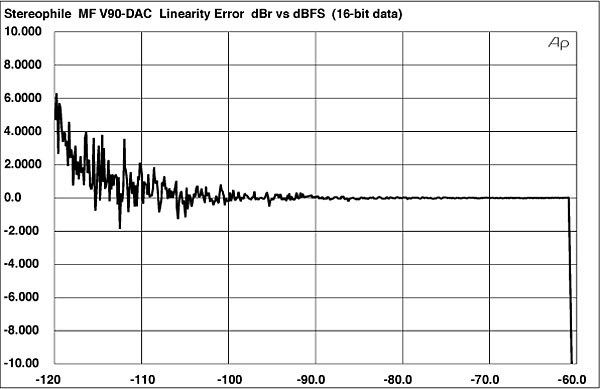
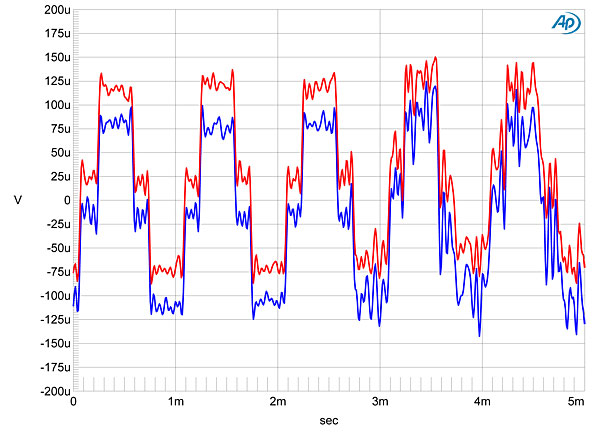
Linearity error with 16-bit data was very low, at less than ±1dB to –110dB (fig.7), while the V90-DAC's reproduction of an undithered sinewave at exactly –90.31dBFS was excellent, with the three DC voltage levels described by the data well defined (fig.8). With 24-bit data at the same level the result was a well-defined sinewave (fig.9), though both the 16- and 24-bit waveforms were overlaid with intermittent high-frequency noise.
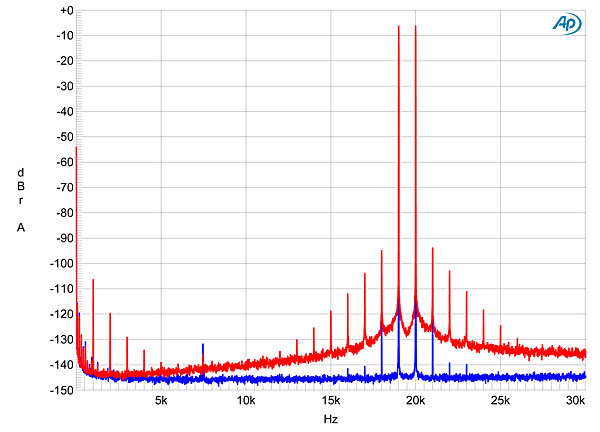
As is usual with Musical Fidelity products, the V90-DAC featured low levels of harmonic distortion. Fig.10 shows the spectrum of the processor's output while it drove a full-scale 50Hz tone into 100k ohms. The highest-level harmonic is the second, at a low –102dB (right) and –110dB (left). Reducing the load impedance to a punishing 600 ohms increased the levels of all harmonics by 10dB or so, though they all remained low in absolute terms. The picture was similar when it came to intermodulation distortion, with very low production of distortion products (fig.11). However, this graph reveals a strange rise in the noise floor around the 19 and 20kHz tones, in only the right channel (red trace). If you look closely at fig.2, you can see a similar rise in the noise floor around the 19.1kHz tone in the right channel (blue trace), but not in the left (cyan).
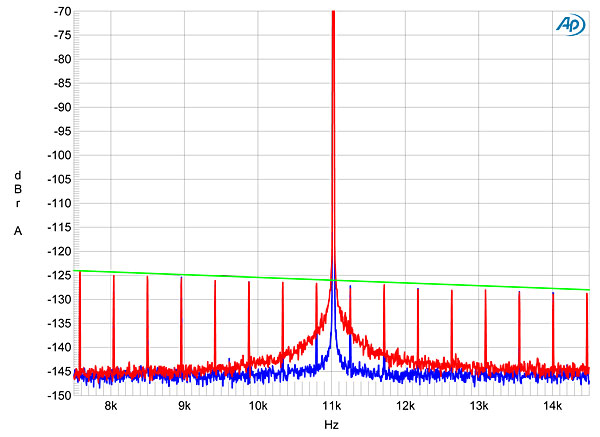
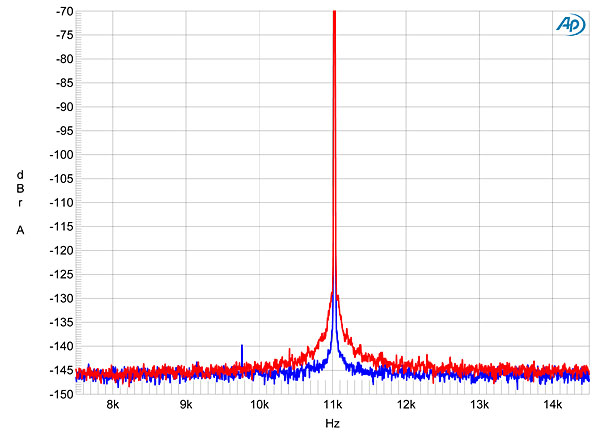
This noise-floor modulation in the right channel can also be seen in a narrowband spectrum of the Musical Fidelity's output while it decoded 16-bit data representing the Miller-Dunn J-Test signal (fig.12). However, no jitter-related sidebands are visible, and the odd-order harmonics of the low-frequency, LSB-level squarewave are all at the correct levels (green line). These harmonics disappeared with 24-bit J-Test data (fig.13), but the spectral spreading can still be seen in the right channel. These two graphs were taken with TosLink data; the behavior was identical with coaxial S/PDIF and USB data.
Overall, other than that peculiar noise-floor modulation in the right channel, which didn't seem to affect what ST or I heard, the V90-DAC measures very similarly to Musical Fidelity's V-DAC II, which definitely punched above its weight on the test bench.—John Atkinson


