
Noise was low, the A-weighted S/N ratio (ref. 1W into 8 ohms) being a good 77.3dB. This figure worsened only slightly, to 71.4dB, with an unweighted, wideband measurement. Distortion levels on continuous tones were very low; I had to drive the amplifier at a high level (125W into 8 ohms) to extract the waveform of the distortion residual from the noise. This (fig.4) is mainly second harmonic. Some third harmonic appeared at 250W into 4 ohms, but at a very low level. 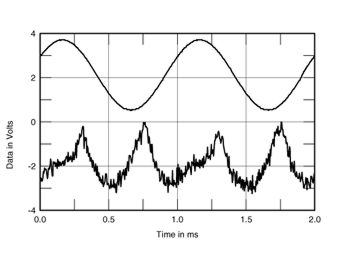 Fig.4 Musical Fidelity Nu-Vista 300, 1kHz waveform at 125W into 4 ohms (top), distortion and noise waveform with fundamental notched out (bottom, not to scale). With respect to distortion, the Nu-Vista 300 is more like a preamplifier than a very high-power amplifier. Fig.5, for example, shows the spectrum of the Nu-Vista 300's output while it drove a 50Hz sinewave at 243W into 8 ohms. Despite the level being just 1dB below the clipping point, the harmonics are all at low levels, with the second, third, fifth, and sixth harmonics evident at -90dB (0.003%) or below. Plotting the distortion and noise content against frequency at a 2.83V level resulted in the traces shown in fig.6. The measured distortion increases only slightly as the load impedance drops from 8 to 4 to 2 ohms, though a slight rise is apparent in the top audio octave and above, reaching 0.1% at 50kHz. Even in the high-frequency intermodulation torture test (fig.7), the 1kHz difference tone remained below -70dB (0.03%).
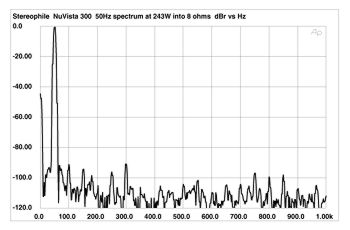 Fig.5 Musical Fidelity Nu-Vista 300, spectrum of 50Hz sinewave, DC-1kHz, at 243W into 8 ohms (linear frequency scale).
 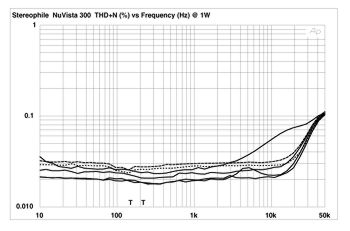 Fig.6 Musical Fidelity Nu-Vista 300, THD+noise (%) vs frequency at (from top to bottom at 2kHz): 4W into 2 ohms, 2W into 4 ohms, 1W into 8 ohms, and 2.83V into simulated loudspeaker load (right channel dashed).
 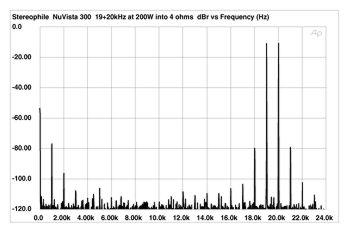 Fig.7 Musical Fidelity Nu-Vista 300, HF intermodulation spectrum, DC-22kHz, 19+20kHz at 200W into 4 ohms (linear frequency scale).
Fig.4 Musical Fidelity Nu-Vista 300, 1kHz waveform at 125W into 4 ohms (top), distortion and noise waveform with fundamental notched out (bottom, not to scale). With respect to distortion, the Nu-Vista 300 is more like a preamplifier than a very high-power amplifier. Fig.5, for example, shows the spectrum of the Nu-Vista 300's output while it drove a 50Hz sinewave at 243W into 8 ohms. Despite the level being just 1dB below the clipping point, the harmonics are all at low levels, with the second, third, fifth, and sixth harmonics evident at -90dB (0.003%) or below. Plotting the distortion and noise content against frequency at a 2.83V level resulted in the traces shown in fig.6. The measured distortion increases only slightly as the load impedance drops from 8 to 4 to 2 ohms, though a slight rise is apparent in the top audio octave and above, reaching 0.1% at 50kHz. Even in the high-frequency intermodulation torture test (fig.7), the 1kHz difference tone remained below -70dB (0.03%). Fig.5 Musical Fidelity Nu-Vista 300, spectrum of 50Hz sinewave, DC-1kHz, at 243W into 8 ohms (linear frequency scale). Fig.6 Musical Fidelity Nu-Vista 300, THD+noise (%) vs frequency at (from top to bottom at 2kHz): 4W into 2 ohms, 2W into 4 ohms, 1W into 8 ohms, and 2.83V into simulated loudspeaker load (right channel dashed). Fig.7 Musical Fidelity Nu-Vista 300, HF intermodulation spectrum, DC-22kHz, 19+20kHz at 200W into 4 ohms (linear frequency scale).