Sidebar 3: Measurements
I examined the Luxman DA-06's electrical performance with my Audio Precision SYS2722 system (see www.ap.com and the January 2008 "As We See It"). Unless stated otherwise, all measurements were performed from the DA-06's balanced outputs. I don't yet have files of DSD-encoded test signals, so the DA-06's measured performance was assessed with PCM-encoded files, with sample rates extending up to 384kHz.
The Luxman's performance via its USB port was tested using my 2012-vintage Apple MacBook Pro. Apple's USB Prober utility identified the Luxman as having the product string "USB D/A Converter DA-06" and manufacturer string "Luxman," and confirmed that the processor's USB input operated with the preferred isochronous asynchronous protocol. The AudioMIDI utility listed all sample rates from 32 to 384kHz as being possible via USB, with 24-bit word lengths. The TosLink inputs locked to datastreams with sample rates up to 96kHz; the coaxial and AES/EBU inputs operated successfully with datastreams up to 192kHz.
The Luxman's maximum output level at 1kHz was the same from the balanced and unbalanced outputs: 2.36V, or 1.43dB higher than the CD standard's 2V RMS. With the output polarity set to "2-P" with the front-panel button, the balanced output preserved absolute polarity (ie, was non-inverting), though the unbalanced output did invert polarity. With the output set to "3-P," the unbalanced output now preserved absolute polarity and the balanced output inverted it. The source impedance from the balanced output was close to the specified 600 ohms, at 590 ohms at low and middle frequencies, dropping slightly to 576 ohms at the top of the audioband. The unbalanced output impedance was half these values, as expected.
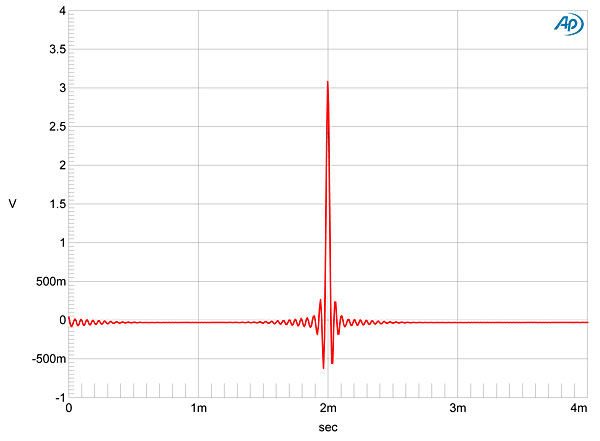
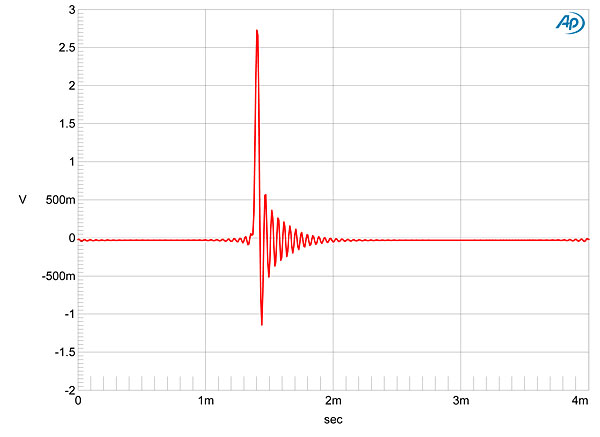
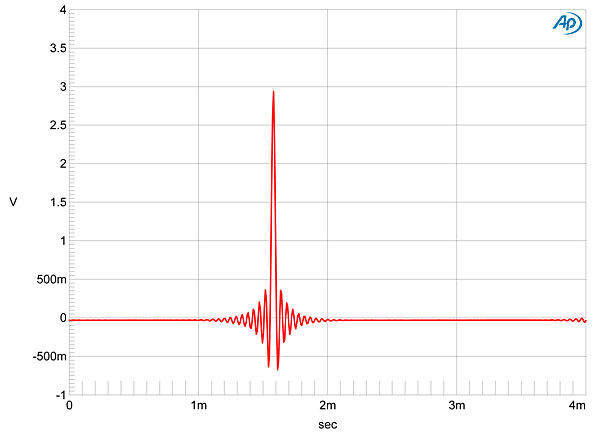
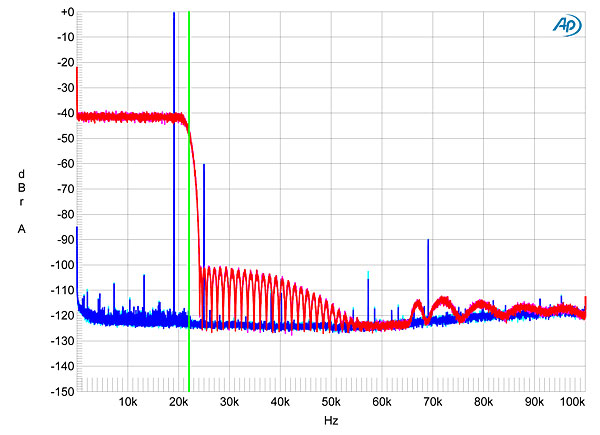
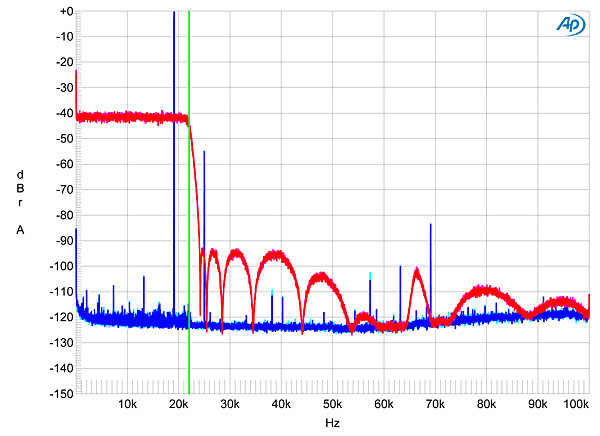
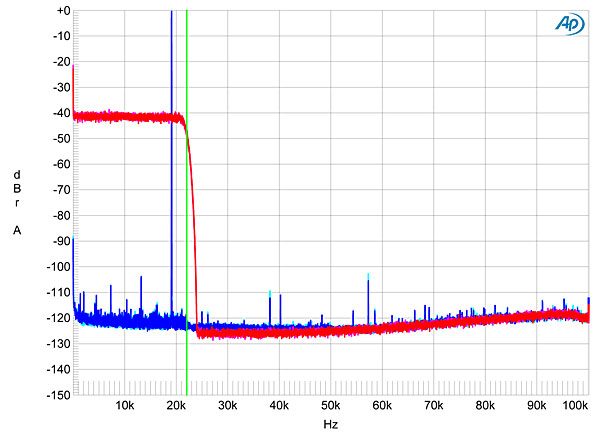
The DA-06 offers a choice of three reconstruction filters for PCM playback, labeled "P-1 (normal FIR filter)," "P-2 (low latency IIR filter)," and "P-3 (high attenuation FIR filter)." Figs. 1–3 show the impulse response for these three filters with 44.1kHz data. Figs. 1 and 3 indicate that P-1 and P-3 are similar linear-phase types, with symmetrical ringing around the impulse, though P-1 has fewer coefficients than P-3. P-2 (fig.2) is a minimum-phase type, with all the ringing occurring after the impulse. (This is similar to the filter used in Art Dudley's Halide DAC HD.) With the test suggested to me by MBL's JÅrgen Reis, filters P-1 and P-2 can be seen to have similarly slow ultrasonic rolloffs with 44.1kHz-sampled white noise (magenta and red traces in figs. 4 and 5, respectively), but with rather different top-band rejections. The image of a full-scale 19.1kHz tone at 25kHz is suppressed to only a moderate degree compared with filter P-3 (fig.6), which has a faster rate of rolloff.
 Harmonic distortion levels are low (fig.13), even into the very low 600 ohm load, and the second and third harmonics are the highest in level. These would be subjectively innocuous even if they were much higher in level than the –106dB (0.0005%) they are in the DA-06's output. Intermodulation distortion is also very low, with the 1kHz difference product produced by a full-scale mix of 19 and 20kHz tones lying at –110dB (0.0003%), as seen in fig.14. This graph was taken with filter P-2 and, as expected from fig.5, the ultrasonic images of the two primary tones are suppressed by just over 60dB. With the faster rollout of P-3, these images are attenuated by another 50dB (fig.15).
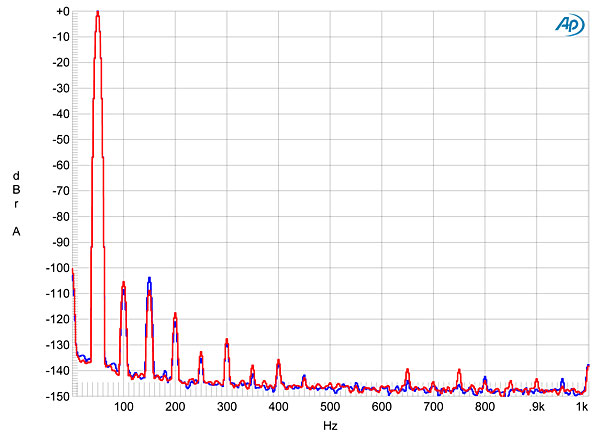
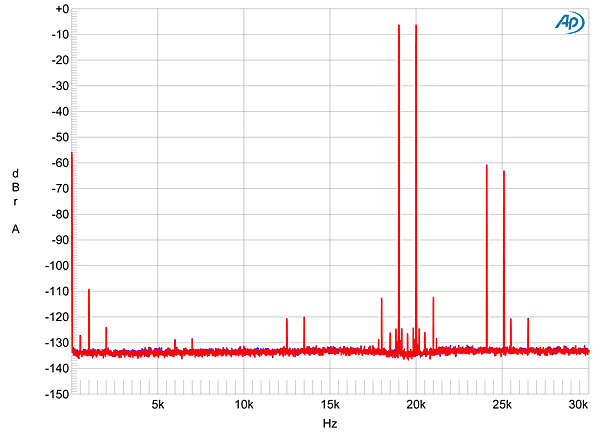
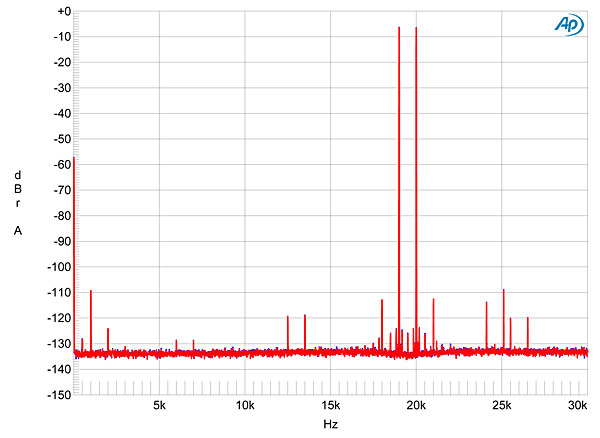
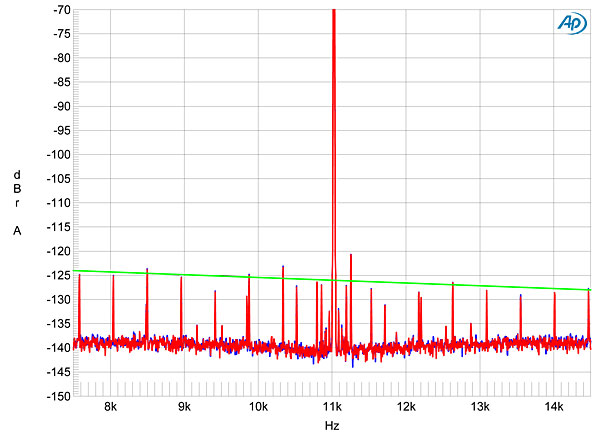
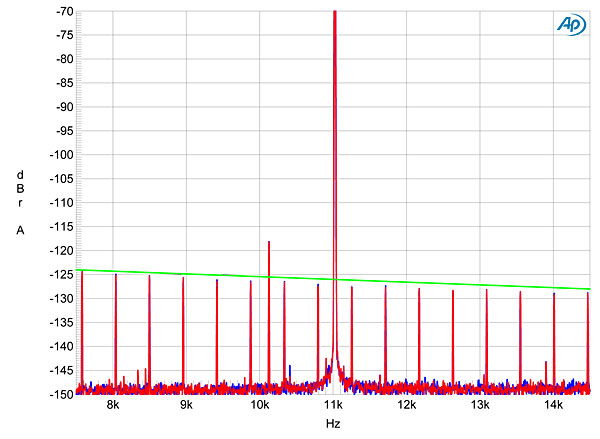
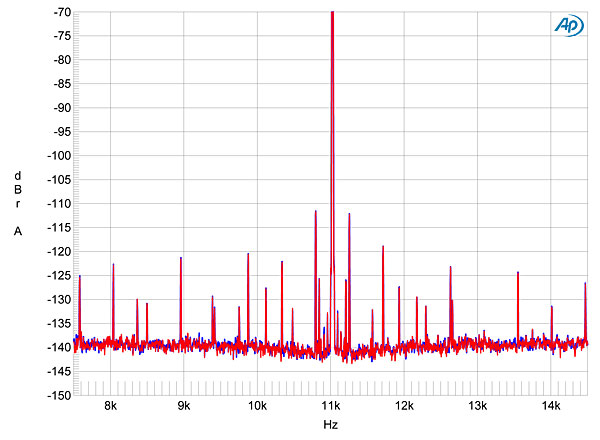
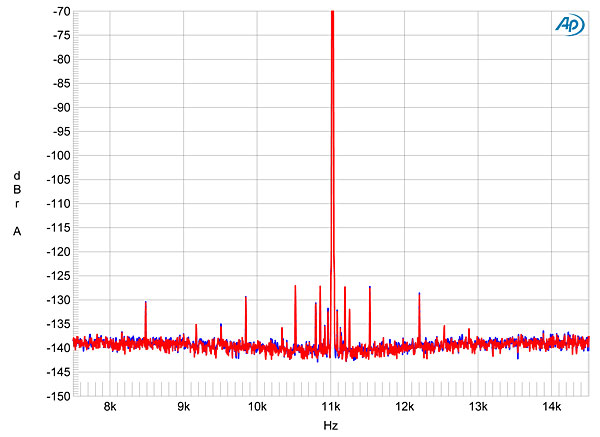
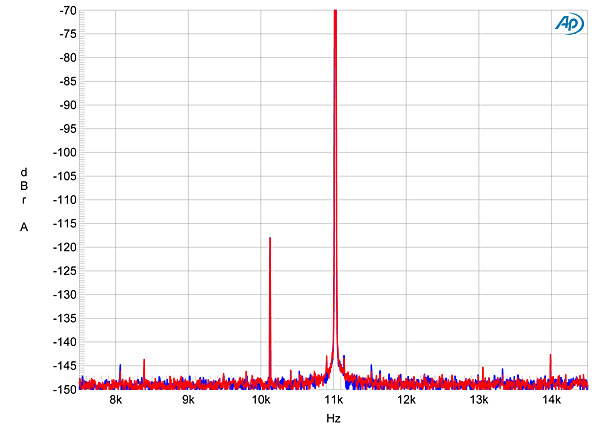
Fig.1 Luxman DA-06, PCM filter P-1, impulse response at 44.1kHz (4ms time window).
Fig.2 Luxman DA-06, PCM filter P-2, impulse response at 44.1kHz (4ms time window).
Fig.3 Luxman DA-06, PCM filter P-3, impulse response at 44.1kHz (4ms time window).
Fig.4 Luxman DA-06, PCM filter P-1, wideband spectrum of white noise at –4dBFS (left channel blue, right magenta) and 19.1kHz tone at 0dBFS (left cyan, right red), with data sampled at 44.1kHz (20dB/vertical div.).
Fig.5 Luxman DA-06, PCM filter P-2, wideband spectrum of white noise at –4dBFS (left channel blue, right magenta) and 19.1kHz tone at 0dBFS (left cyan, right red), with data sampled at 44.1kHz (20dB/vertical div.).
Fig.6 Luxman DA-06, PCM filter P-3, wideband spectrum of white noise at –4dBFS (left channel blue, right magenta) and 19.1kHz tone at 0dBFS (left cyan, right red), with data sampled at 44.1kHz (20dB/vertical div.).
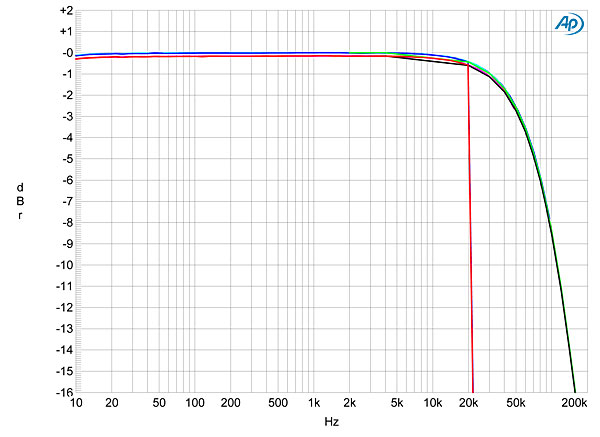
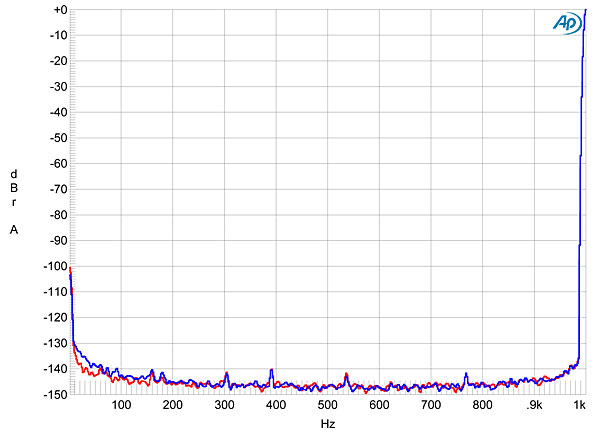
Fig.7 is a more conventional way of showing the DA-6's frequency response, taken with sample rates of 44.1, 96, 192, and 384kHz. The response with all four sample rates is down by 0.5dB at 20kHz, with then (other than the 384kHz traces) a sharp rolloff just before each Nyquist frequency (half the sample rate). There is superbly close matching between the two channels' output levels. Channel separation was also superb, at >125dB in both directions below 1kHz, and still 110dB (L–R) and 113dB (R–L) at 20kHz. The Luxman's low-frequency noise floor (fig.8) was commendably free from power-supply–related spuriae.
Fig.7 Luxman DA-06, PCM filter P-2, frequency response at –12dBFS into 100k ohms with data sampled at: 44.1kHz (left channel blue, right red), 96kHz (left cyan, right magenta), 192kHz (left blue, right red), 384kHz (left green, right gray) (1dB/vertical div.).
Fig.8 Luxman DA-06, spectrum of 1kHz sinewave, DC–1kHz, at 0dBFS into 100k ohms (left channel blue, right red; linear frequency scale).
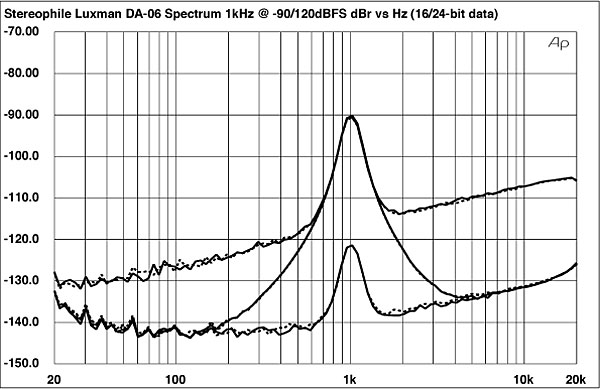
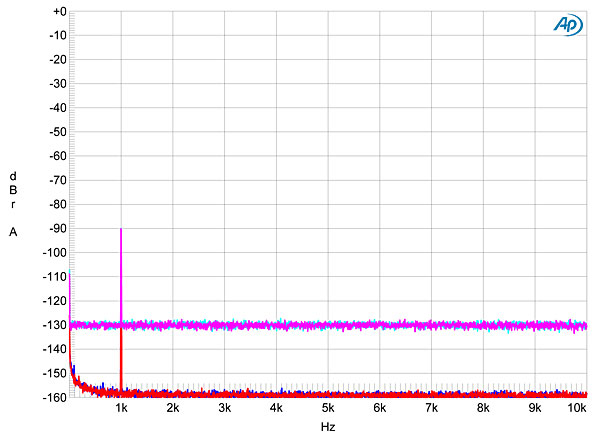
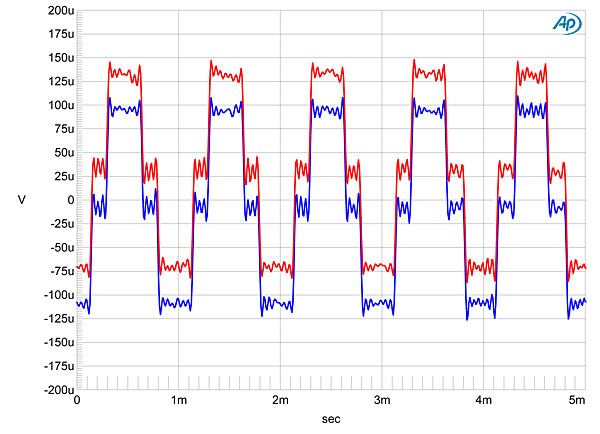
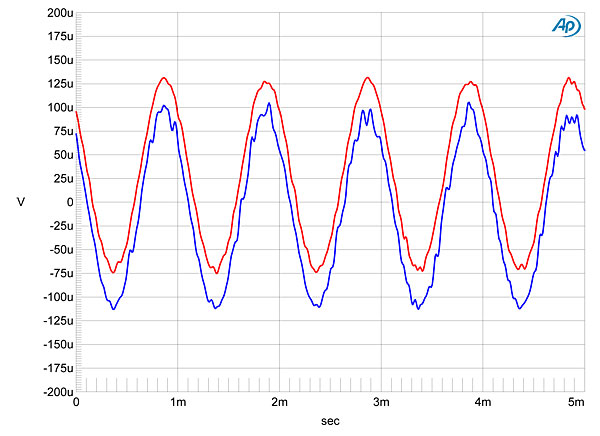
With a dithered 1kHz tone at –90dBFS, the spectral spike at 1kHz peaks at exactly –90dBFS (figs.9 & 10), while increasing the bit depth from 16 (cyan and magenta traces) to 24 (blue, red) drops the noise floor by almost 30dB, implying resolution of almost 21 bits, which is close to the state of the art for audio data. With this high resolution and low noise, the Luxman's reproduction of an undithered 16-bit tone at exactly –90.31dBFS (fig.11) was essentially perfect. The waveform is perfectly symmetrical, the Gibbs Phenomenon "ringing" on the tops and bottoms of the waveform is clearly evident (I used filter P-1 for this test), and the three DC voltage levels described by the data are well defined. The 25µV of DC offset seen in the right channel (red trace) is trivial. With undithered 24-bit data, the result is a well-formed sinewave (fig.12).
Fig.9 Luxman DA-06, 1/3-octave spectrum with noise and spuriae of dithered 1kHz tone at –90dBFS with 16-bit data (left channel bottom at 20kHz) and 24-bit data (right channel bottom at 5kHz) (right channel dashed).
Fig.10 Luxman DA-06, spectrum with noise and spuriae of dithered 1kHz tone at –90dBFS with: 16-bit data (left channel cyan, right magenta), 24-bit data (left blue, right red) (10dB/vertical div.).
Fig.11 Luxman DA-06, waveform of undithered 1kHz sinewave at –90.31dBFS, 16-bit data (left channel blue, right red).
Fig.12 Luxman DA-06, waveform of undithered 1kHz sinewave at –90.31dBFS, 24-bit data (left channel blue, right red).
Fig.13 Luxman DA-06, spectrum of 50Hz sinewave, DC–1kHz, at 0dBFS into 100k ohms (left channel blue, right red; linear frequency scale).
Fig.14 Luxman DA-06, PCM filter P-2, HF intermodulation spectrum, DC–30kHz, 19+20kHz at 0dBFS into 600 ohms (left channel blue, right red; linear frequency scale).
Fig.15 Luxman DA-06, PCM filter P-3, HF intermodulation spectrum, DC–30kHz, 19+20kHz at 0dBFS into 600 ohms (left channel blue, right red; linear frequency scale).
Tested for its rejection of word-clock jitter with the 16-bit J-Test signal, sourced via a TosLink optical connection, the DA-06 didn't perform as well as I might have expected. Most of the odd-order harmonics of the low-frequency, LSB-level squarewave in the processor's analog output were at the correct levels, as shown by the green line in fig.16. However, there are low-level sideband pairs at ±60 and ±168Hz. The first pair is obviously power-supply induced; the second pair is of unknown origin. The random noise floor is also higher in level than the previous tests had led me to expect. Repeating this test with 16-bit USB data gave a much cleaner-looking spectrum (fig.17), though there is now a suspicious peak at 10.126kHz—perhaps an idle tone of some kind. These sidebands were even higher in level with AES/EBU data (fig.18).
Fig.16 Luxman DA-06, high-resolution jitter spectrum of analog output signal, 11.025kHz at –6dBFS, sampled at 44.1kHz with LSB toggled at 229Hz: 16-bit data via TosLink from AP SYS2722 (left channel blue, right red). Center frequency of trace, 11.025kHz; frequency range, ±3.5kHz.
Fig.17 Luxman DA-06, high-resolution jitter spectrum of analog output signal, 11.025kHz at –6dBFS, sampled at 44.1kHz with LSB toggled at 229Hz: 16-bit data via USB from MacBook Pro (left channel blue, right red). Center frequency of trace, 11.025kHz; frequency range, ±3.5kHz.
Fig.18 Luxman DA-06, high-resolution jitter spectrum of analog output signal, 11.025kHz at –6dBFS, sampled at 44.1kHz with LSB toggled at 229Hz: 16-bit data via AES/EBU from AP SYS2722 (left channel blue, right red). Center frequency of trace, 11.025kHz; frequency range, ±3.5kHz.
Retesting the TosLink input with 24-bit J-Test data gave the spectrum shown in fig.19. Again, the noise floor is higher than expected, and some data-related sidebands are present that shouldn't be. But the USB-derived 24-bit spectrum (fig.20) was again very clean, other than the same idle tone that was present in the 16-bit spectrum.
Fig.19 Luxman DA-06, high-resolution jitter spectrum of analog output signal, 11.025kHz at –6dBFS, sampled at 44.1kHz with LSB toggled at 229Hz: 24-bit data via TosLink from AP SYS2722 (left channel blue, right red). Center frequency of trace, 11.025kHz; frequency range, ±3.5kHz.
Fig.20 Luxman DA-06, high-resolution jitter spectrum of analog output signal, 11.025kHz at –6dBFS, sampled at 44.1kHz with LSB toggled at 229Hz: 24-bit data via USB from MacBook Pro (left channel blue, right red). Center frequency of trace, 11.025kHz; frequency range, ±3.5kHz.
But other than the S/PDIF and AES/EBU inputs' rejection of jitter, the DA-06's measured performance is simply superb.—John Atkinson


