Sidebar 3: Measurements
I measured the Lumin P1 with my Audio Precision SYS2722 system. Looking first at the digital inputs, the AES3 and coaxial and TosLink S/PDIF inputs accepted data sampled at all rates up to 192kHz. Apple's AudioMIDI utility revealed that the P1 accepted 16- and 32-bit integer data via USB sampled at all rates from 44.1kHz to 768kHz (footnote 1). Apple's USB Prober app identified the Lumin as "LUMIN" from "PMS" (Pixel Magic Systems, presumably), and the USB port operated in the optimal isochronous asynchronous mode.
The Lumin's analog outputs with the Invert Phase control set to Off preserved absolute polarity (ie, were noninverting) via all of the P1's digital inputs. The maximum output with full-scale 1kHz data and the Gain set to High was 2.95V from the P1's single-ended analog outputs and 5.89V from the balanced outputs. Setting the Gain to Low gave maximum output levels of 987.4mV single-ended and 1.974V balanced. The balanced output impedance was a usefully low 37 ohms from 20Hz to 20kHz. The single-ended output impedance was an even lower 30.1 ohms, again at all audio frequencies.
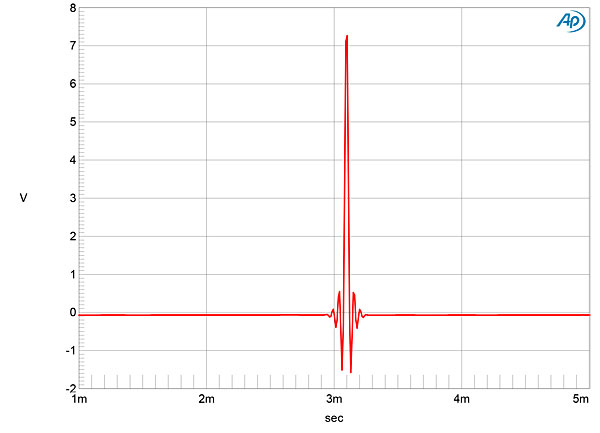
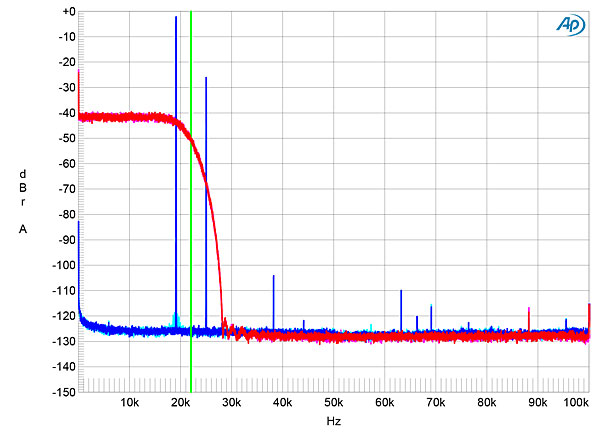
Fig.1 shows the P1's impulse response with 44.1kHz data. It is a very short linear-phase reconstruction filter, with a small amount of ringing on both sides of the single full-scale sample. With 44.1kHz white-noise data, the filter rolled off slowly above the audioband (fig.2, magenta and red traces), not reaching full stop-band attenuation until 28kHz. Consequently, the aliased image at 25kHz of a full-scale tone at 19.1kHz (cyan, blue) is suppressed by only 27dB. The harmonics associated with the 19.1kHz tone are all very low in level.
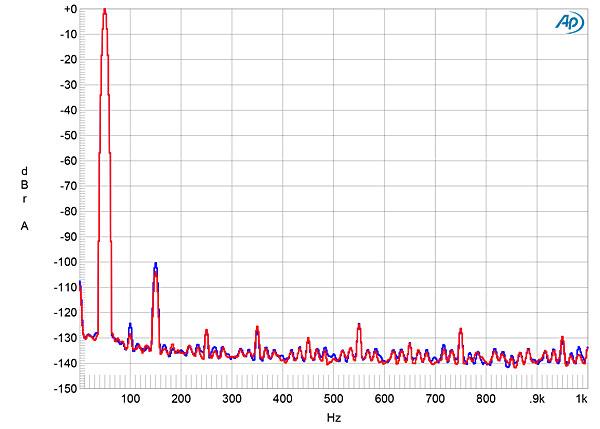
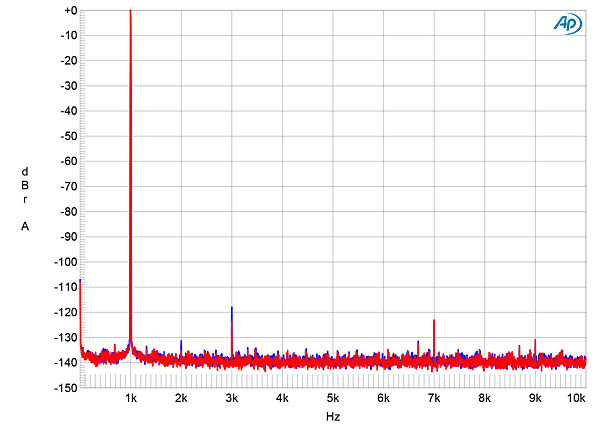
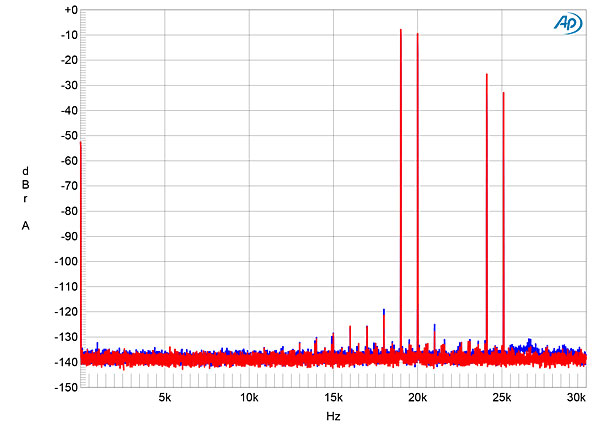
 The P1 produced very low levels of harmonic distortion. With a full-scale 50Hz tone, the third harmonic was the highest in level in the balanced outputs at just –100dB (0.001%, fig.9). This spectrum was taken into the high 100k ohms load. When I reduced the load impedance to the punishing 600 ohms, the levels of the harmonic didn't change, a tribute to the quality of the Lundahl output transformers. With the unbalanced output driving 100k ohms, the third harmonic with the 50Hz tone rose to –90dB (0.003%), but this is still negligible. Repeating the spectral analysis with a 1kHz tone at 0dBFS, the third harmonic in the balanced output lay at just –119dB (0.0001%, fig.10). Intermodulation distortion with an equal mix of 19 and 20kHz tones, each lying at –6dBFS, was vanishingly low in level (fig.11), though the aliased images of the primary tones are present.
 Lumin's P1 did very well on the test bench.—John Atkinson
Footnote 1: This is the sample-rate acceptance window of the XMOS USB data receiver chip. The P1 itself appears to be limited to a maximum PCM rate of 384kHz.
Fig.1 Lumin P1, impulse response (one sample at 0dBFS, 44.1kHz sampling, 4ms time window).
Fig.2 Lumin P1, wideband spectrum of white noise at –4dBFS (left channel red, right magenta) and 19.1kHz tone at 0dBFS (left blue, right cyan) into 100k ohms with data sampled at 44.1kHz (20dB/vertical div.).
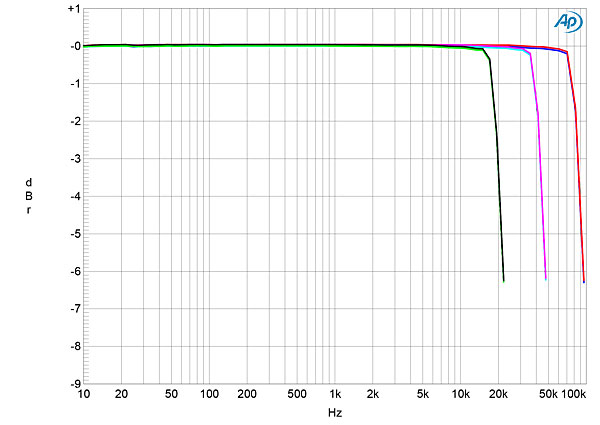
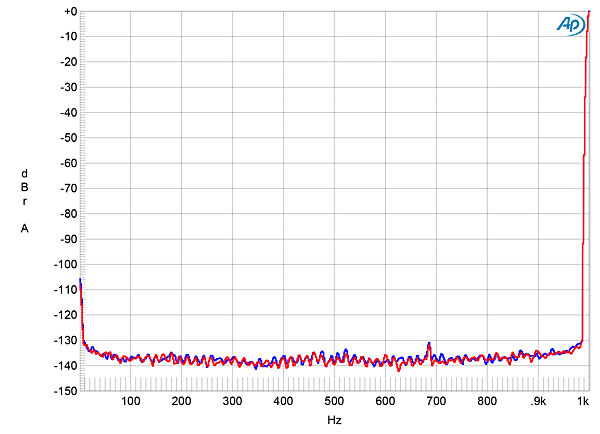
Fig.3 shows the Lumin's frequency response with data sampled at 44.1, 96, and 192kHz. The responses are all flat to almost half the sample rate with then the beginning of the ultrasonic rolloff. Channel separation (not shown) was superb, at >125dB in both directions below 1kHz. It decreased to a still-excellent 113dB at the top of the audioband. The low-frequency noisefloor (fig.4) was free from any power supply–related spuriae. This graph was taken with TosLink data; the spectrum with network-sourced data was identical.
Fig.3 Lumin P1, frequency response at –12dBFS into 100k ohms with data sampled at: 44.1kHz (left channel green, right gray), 96kHz (left cyan, right magenta), and 192kHz (left blue, right red) (1dB/vertical div.).
Fig.4 Lumin P1, balanced output, spectrum with noise and spuriae of dithered 1kHz tone at 0dBFS with 24-bit TosLink data (left blue, right red) (20dB/vertical div.).
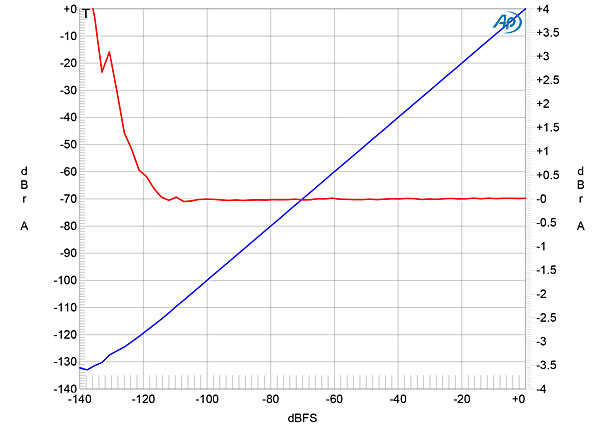
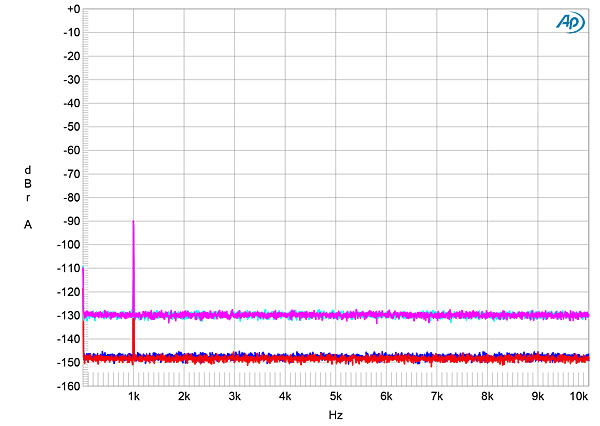
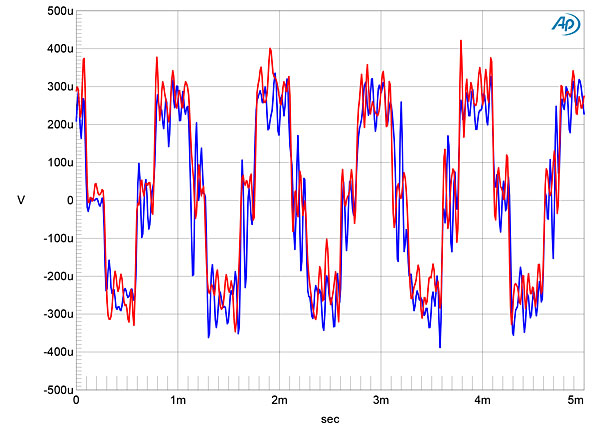
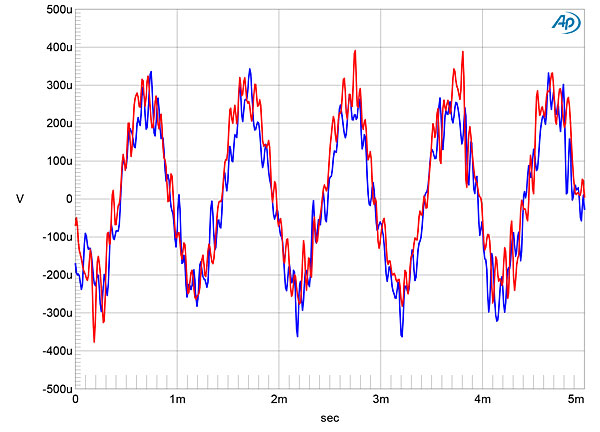
The red trace in fig.5 plots the error in the analog output level as a 24-bit, 1kHz digital tone drops from 0dBFS to –140dBFS. The amplitude error is negligible until the signal lies below –120dBFS, which implies high resolution. An increase in bit depth from 16 to 24 with dithered data representing a 1kHz tone at –90dBFS (fig.6) dropped the P1's noisefloor by almost 20dB, which implies a resolution of better than 19 bits. When I played undithered data representing a tone at exactly –90.31dBFS, the waveform was symmetrical, though the three DC voltage levels described by the data were overlaid with some high-frequency noise (fig.7). Repeating the measurement with undithered 24-bit data gave a well-formed sinewave (fig.8), but some high-frequency noise was still present.
Fig.5 Lumin P1, left channel, 1kHz output level vs 24-bit data level in dBFS (blue, 20dB/vertical div.); linearity error (red, 1dB/small vertical div.).
Fig.6 Lumin P1, spectrum with noise and spuriae of dithered 1kHz tone at –90dBFS with: 16-bit TosLink data (left channel cyan, right magenta), 24-bit TosLink data (left blue, right red) (20dB/vertical div.).
Fig.7 Lumin P1, waveform of undithered 1kHz sinewave at –90.31dBFS, 16-bit data (left channel blue, right red).
Fig.8 Lumin P1, waveform of undithered 1kHz sinewave at –90.31dBFS, 24-bit data (left channel blue, right red).
Fig.9 Lumin P1, balanced output, 24-bit TosLink data, spectrum of 50Hz sinewave, DC–1kHz, at 0dBFS into 100k ohms (left channel blue, right red; linear frequency scale).
Fig.10 Lumin P1, balanced output, 24-bit TosLink data, spectrum of 1kHz sinewave, DC–10kHz, at 0dBFS into 100k ohms (left channel blue, right red; linear frequency scale).
Fig.11 Lumin P1, balanced output, 24-bit TosLink data, HF intermodulation spectrum, DC–30kHz, 19+20kHz at 0dBFS into 100k ohms, 44.1kHz data (left channel blue, right red; linear frequency scale).
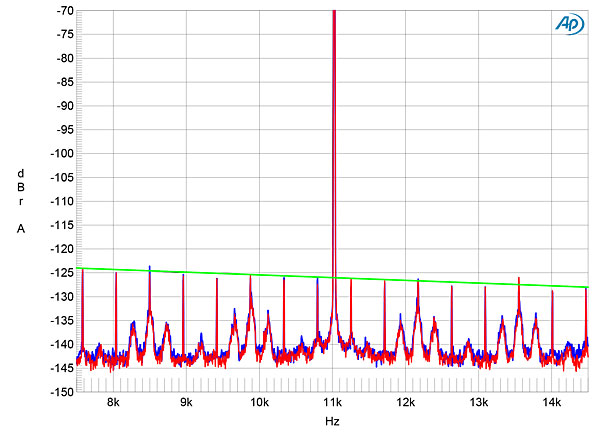
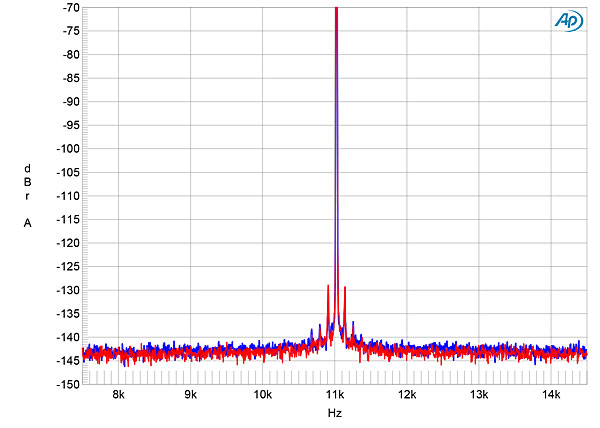
Fig.12 shows the spectrum of the P1's output when it was fed high-level, optical 16-bit J-Test data. The odd-order harmonics of the undithered low-frequency, LSB-level squarewave lie at the correct levels, indicated by the sloping green line. While some very low-level noisefloor modulation is visible around some of the sidebands, this should not have audible consequences. This behavior was not present with 24-bit J-Test data (fig.13), though a pair of sidebands at ±120Hz is visible in this graph. The spectrum in fig.13 was taken with network data; the AES3 and S/PDIF inputs behaved identically, though these supply-related sidebands were a little higher in level with USB data.
Fig.12 Lumin P1, high-resolution jitter spectrum of analog output signal, 11.025kHz at –6dBFS, sampled at 44.1kHz with LSB toggled at 229Hz: 16-bit TosLink data (left channel blue, right red). Center frequency of trace, 11.025kHz; frequency range, ±3.5kHz.
Fig.13 Lumin P1, high-resolution jitter spectrum of analog output signal, 11.025kHz at –6dBFS, sampled at 44.1kHz with LSB toggled at 229Hz: 24-bit Ethernet data (left channel blue, right red). Center frequency of trace, 11.025kHz; frequency range, ±3.5kHz.
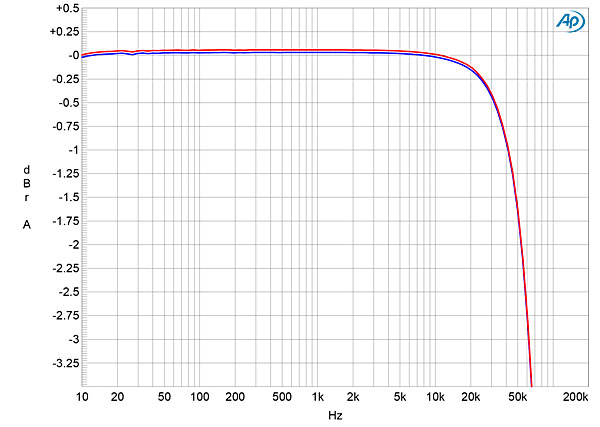
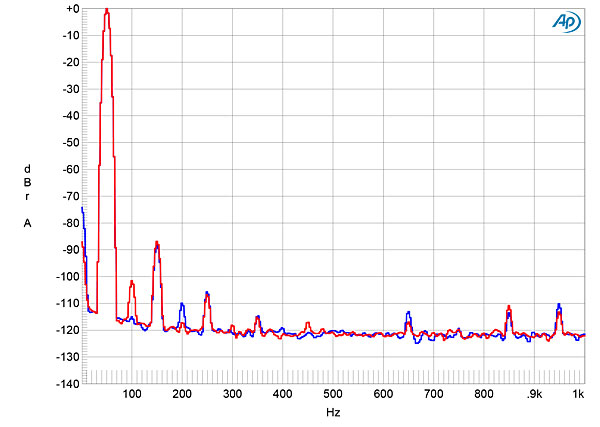
Turning to the Lumin's analog inputs, the input impedance was low, at 1240 ohms balanced and 1260 ohms unbalanced, which might be a problem with source components having tubed output stages. The maximum gain for balanced inputs and outputs was –0.13dB, ie, an input of 1V resulted in an output of 983mV. For single-ended inputs, the maximum gain was –0.43dB at the unbalanced outputs but 5.56dB at the balanced outputs. Both sets of analog outputs preserved absolute polarity with both types of analog input signals. The analog inputs offered a wide frequency response, with the output down by 3dB at 61kHz (fig.14). (This response was not affected by the sample rate of data present at the digital inputs.) The distortion via the analog inputs was slightly higher than via the digital inputs (fig.15) but was still very low in absolute terms.
Fig.14 Lumin P1, analog input, frequency response (left channel blue, right red) (1dB/vertical div.).
Fig.15 Lumin P1, analog input, spectrum of 50Hz sinewave, DC–1kHz, at 2V into 100k ohms (left channel blue, right red; linear frequency scale).
Footnote 1: This is the sample-rate acceptance window of the XMOS USB data receiver chip. The P1 itself appears to be limited to a maximum PCM rate of 384kHz.


