Sidebar 4: Measurements
I measured the Krell K-300i using my Audio Precision SYS2722 system (see the January 2008 "As We See It"). I usually precondition amplifiers by running them at one- third power into 8 ohms for an hour. The Krell almost made it, turning itself off after 55 minutes, with the front-panel display showing the message "Over temperature left channel." The top panel over the heatsinks was hot, at 142.8°F (61.6°C), but cooler over the transformer at 113.1°F (45.1°C). This is a tough test for an amplifier with a class-AB output stage, as one-third power results in the maximum dissipation in the output devices. The Krell has just sufficient heatsinking for its power rating but should be given plenty of space for ventilation.
After the K-300i had cooled down, I was able to continue with the testing. Looking first at the line-level analog inputs, the Krell's voltage gain into 8 ohms is specified as "25dB, referenced to 2V RMS in balanced and full power output." (The specified maximum output of 150W into 8 ohms is equivalent to a gain of 24.77dB ref. 2V.) However, with the volume control set to its maximum of "100," I measured a gain of 43.5dB for both balanced and unbalanced inputs into 8 ohms. While higher than the specification, this gain is typical for an integrated amplifier. The gain measured at the unbalanced preamplifier outputs was 21.25dB, which is on the high side.
The amplifier preserved absolute polarity (ie, was noninverting) for both XLR and RCA inputs at both the loudspeaker and preamplifier outputs. The single-ended input impedance is specified as 8k ohms, the balanced impedance as 16k ohms. However, my measurements indicated 12.7k ohms for the unbalanced input impedance but a low 4.4k ohms, ie, 2200 ohms per phase, for the balanced impedance.
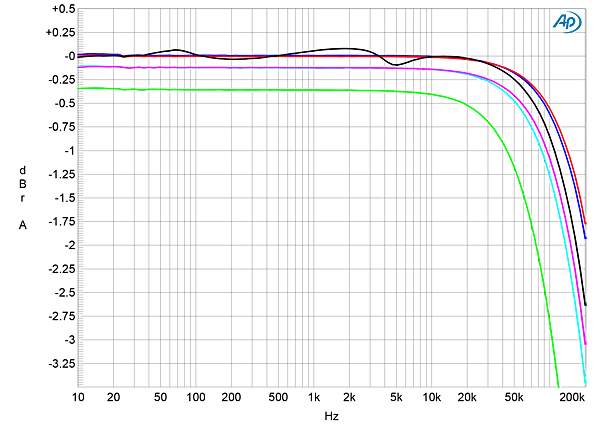
The output impedance is specified as a very low 0.035 ohms from 20Hz to 20kHz. By contrast, I measured 0.131 ohms at 20Hz, 0.133 ohms at 1kHz, and 0.159 ohms at 20kHz, these figures including the series impedance of 6' of loudspeaker cable. Even so, the response with our standard simulated loudspeaker varied by less than ±0.1dB (fig.1, gray trace).
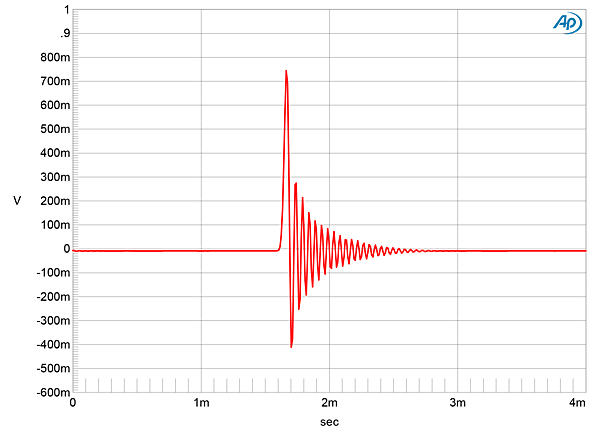
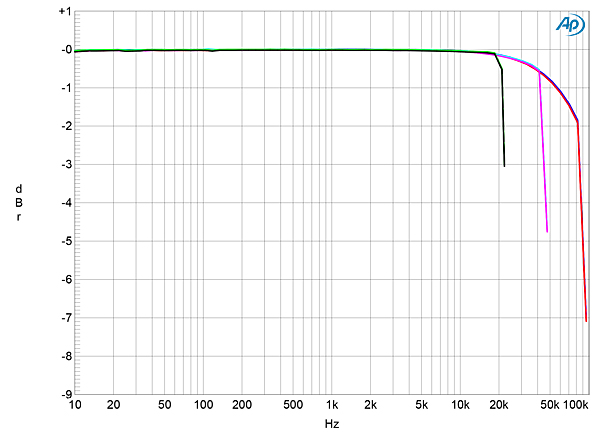
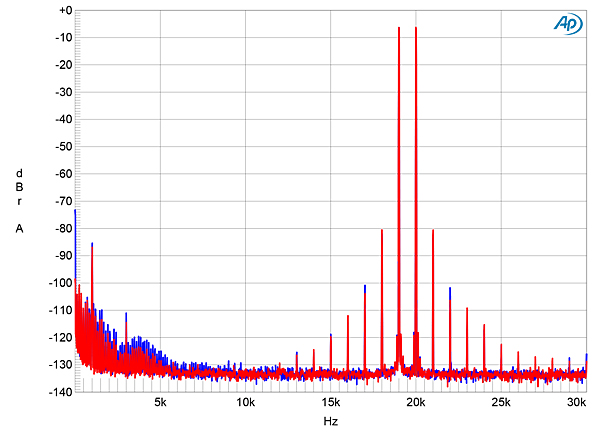 The K-300i's impulse response with 44.1kHz data was a fairly long minimum-phase type, with all the ringing following the single high sample (fig.10). With 44.1kHz-sampled white noise (fig.11, red and magenta traces), the Krell's response reached full stop- band attenuation at 24kHz, suppressing the aliased image at 25kHz of a full-scale tone at 19.1kHz (blue and cyan traces) by almost 110dB. The harmonics of the 19.1kHz tone can be seen in this graph, with the third the highest in level, at –74dB (0.02%). The K-300i's frequency responses with data at 44.1, 96, and 192kHz followed the same basic shape but with a sharp rolloff above half of each sample rate (fig.12).
 Overall, the Krell K-300i offers excellent measured performance. The only shortfall was the digital input's very high gain, which probably led to the introduction of low-level supply-related spuriae.—John Atkinson
Fig.1 Krell K-300i, frequency response at 2.83V into: 8 ohms (left channel blue, right red), 4 ohms (left cyan, right magenta), 2 ohms (green), and simulated loudspeaker (gray) (0.5dB/vertical div.).
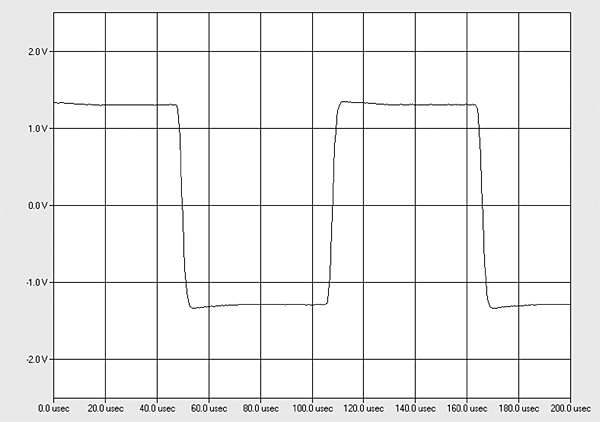
The audioband response into impedances of 8 and 4 ohms (fig.1, blue, red, cyan, and magenta traces) is flat up to 20kHz, and the two channels match very closely. The output into 2 ohms (green trace) was down by just 0.125dB at 20kHz. This graph was taken with the volume control set to "100." Commendably, the ultrasonic rolloff didn't vary at lower volume-control settings, or from the preamplifier outputs. The K-300i amplifier has a wide small-signal bandwidth, and its reproduction of a 10kHz squarewave (fig.2) featured very short risetimes and no overshoot or ringing.
Fig.2 Krell K-300i, small-signal, 10kHz squarewave into 8 ohms.
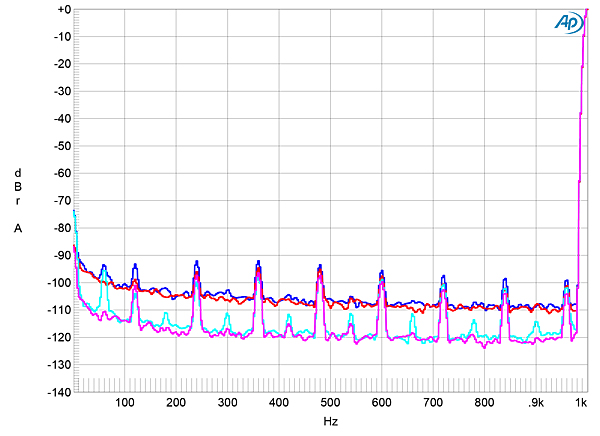
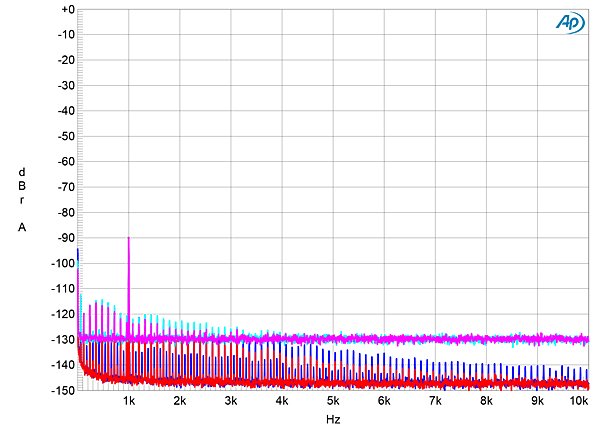
Channel separation was excellent, at 90dB in both directions at 1kHz, though it reduced to 67dB, R–L, and 75dB, L–R, at 20kHz. The wideband, unweighted S/N ratio, ref. 2.83V and measured with the volume control at "100" and the unbalanced input shorted to ground, was 63dB (average of both channels), which improved to 76.5dB when the measurement bandwidth was restricted to the audioband, and to 78.8dB when A-weighted. Spectral analysis of the Krell's noise floor (fig.3) revealed that the random noise level varied with the setting of the volume control, suggesting that this was related to the higher-than-usual preamplifier gain. The spuriae related to the power-line frequency were all very low in level, however.
Fig.3 Krell K-300i, spectrum of 1kHz sinewave, DC–1kHz, at 1W into 8 ohms with volume control set to "80" (left channel cyan, right magenta) and "100" (left blue, right red) (linear frequency scale).
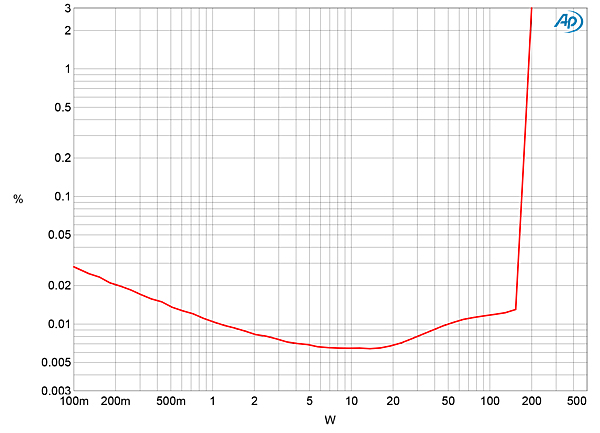
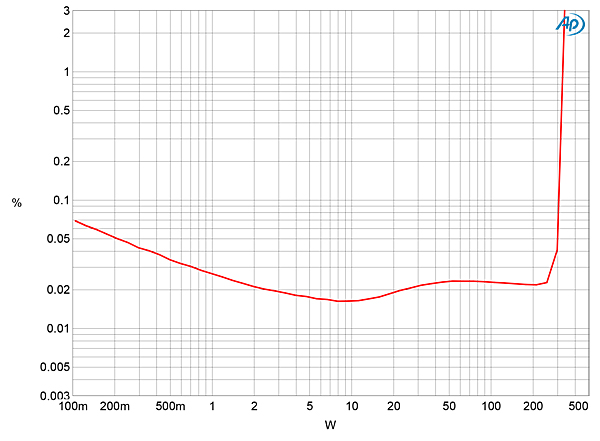
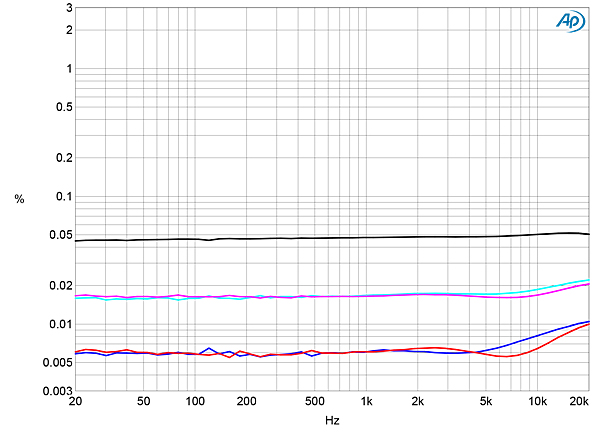
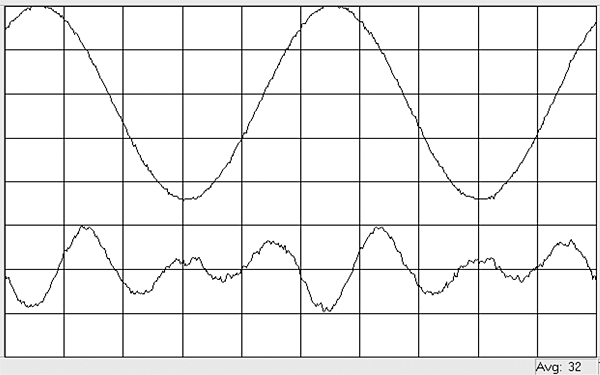
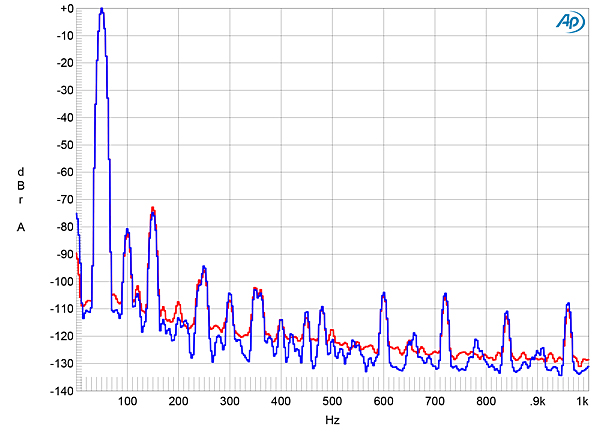
The Krell's maximum power is specified as 150W into 8 ohms and 300W into 4 ohms, both equivalent to 21.8dBW. With "clipping" defined as when the THD+noise reaches 1%, I found that the K-300i exceeded its specified power, clipping at 190W into 8 ohms (22.9dBW, fig.4) and 320W into 4 ohms (22dBW, fig.5). Fig.7 shows how the Krell's THD+N percentage varied with frequency at a moderate output level, 8.975V, into 8, 4, and 2 ohms. Commendably, the distortion in the top audio octave is only slightly higher than it is at low frequencies. The distortion is predominantly third harmonic in character (fig.7), though the second harmonic is only slightly lower in level (fig.8). High-order intermodulation products with an equal mix of 19kHz and 20kHz tones at a peak level of 40W into 4 ohms were relatively low in level (fig.9), and the second-order difference product lay at –86dB (0.005%).
Fig.4 Krell K-300i, distortion (%) vs 1kHz continuous output power into 8 ohms.
Fig.5 Krell K-300i, distortion (%) vs 1kHz continuous output power into 4 ohms.
Fig.6 Krell K-300i, THD+N (%) vs frequency at 8.975V into: 8 ohms (left channel blue, right red), 4 ohms (left cyan, right magenta), and 2 ohms (gray).
Fig.7 Krell K-300i, 1kHz waveform at 20W into 8 ohms, 0.0077% THD+N (top); distortion and noise waveform with fundamental notched out (bottom, not to scale).
Fig.8 Krell K-300i, spectrum of 50Hz sinewave, DC–1kHz, at 40W into 4 ohms (left channel blue, right red) (linear frequency scale).
Fig.9 Krell K-300i, HF intermodulation spectrum, DC–24kHz, 19+20kHz at 40W peak into 4 ohms (left channel blue, right red) (linear frequency scale).
Turning to the digital inputs, Apple's USB Prober utility identified the Krell amplifier as "Krell K-300i" from "KRELL" and indicated that the USB port operated in the optimal isochronous asynchronous mode. Apple's AudioMIDI utility revealed that, via USB, the K-300i accepted 32-bit integer data sampled at all rates from 44.1 to 384kHz. All the digital inputs preserved absolute polarity (ie, were noninverting).
With the Krell's volume control set to its maximum and the level trim set to "0dB," a 1kHz digital signal at –30dBFS resulted in a level of 779.1mV at the preamplifier outputs but 20.23V into 8 ohms from the speaker outputs. The latter is equivalent to 51W, which is just 4.7dB below the specified maximum power. As often appears to be the case with integrated amplifiers, the K-300i's digital inputs have too much gain. I wanted to continue the testing from the preamplifier outputs using the menu to set the output mode set to "Fixed." Peculiarly, however, the volume control was still active in this mode. To avoid blowing up the Krell's output stage with high-level digital test signals, therefore, I continued the testing with the volume control set to "53," which gave a level of 20V at the loudspeaker terminals.
Fig.10 Krell K-300i, digital inputs, impulse response (one sample at 0dBFS, 44.1kHz sampling, 4ms time window).
Fig.11 Krell K-300i, digital inputs, wideband spectrum of white noise at –4dBFS (left channel red, right magenta) and 19.1kHz tone at 0dBFS (left blue, right cyan) into 100k ohms with data sampled at 44.1kHz (20dB/vertical div.).
Fig.12 Krell K-300i, digital inputs, frequency response at –12dBFS into 100k ohms with data sampled at: 44.1kHz (left channel green, right gray), 96kHz (left channel cyan, right magenta), 192kHz (left blue, right red) (1dB/vertical div.).
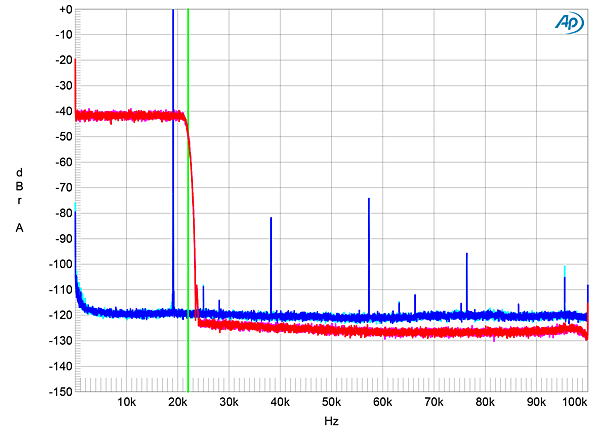
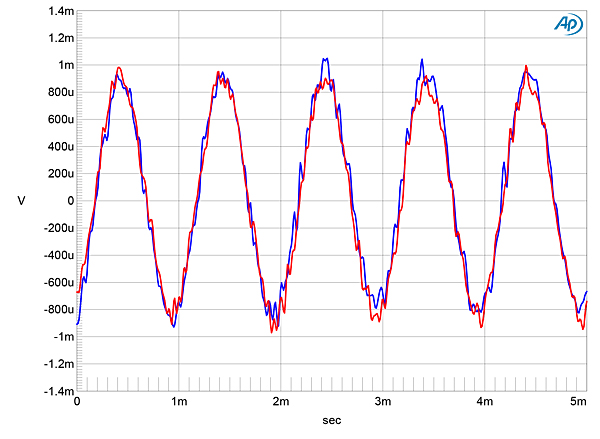
When I increased the bit depth from 16 to 24 with a dithered 1kHz tone at –90dBFS (fig.13), the random noise floor dropped by 18dB, meaning that the Krell's digital inputs offer 19 bits' worth of resolution. However, a lot of low-level AC supply–related spuriae can be seen in this graph. With undithered data representing a tone at exactly –90.31dBFS, the three DC voltage levels described by the data were well resolved and the waveform was perfectly symmetrical (fig.14). With undithered 24-bit data, the result was a superbly clean sinewave (fig.15).
Fig.13 Krell K-300i, digital inputs, spectrum with noise and spuriae of dithered 1kHz tone at –90dBFS with: 16-bit data (left channel cyan, right magenta), 24-bit data (left blue, right red) (20dB/vertical div.).
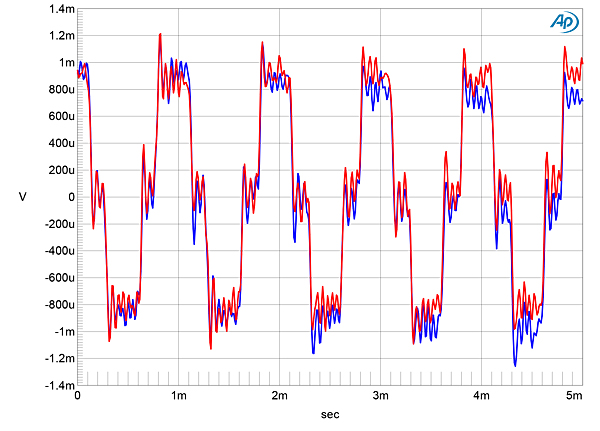
Fig.14 Krell K-300i, digital inputs, waveform of undithered 1kHz sinewave at –90.31dBFS, 16-bit data (left channel blue, right red).
Fig.15 Krell K-300i, digital inputs, waveform of undithered 1kHz sinewave at –90.31dBFS, 24-bit data (left channel blue, right red).
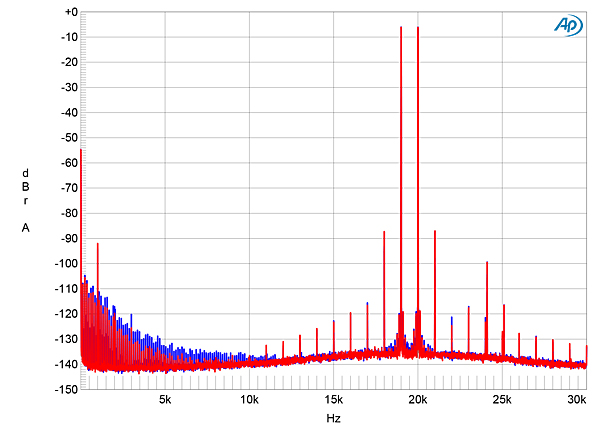
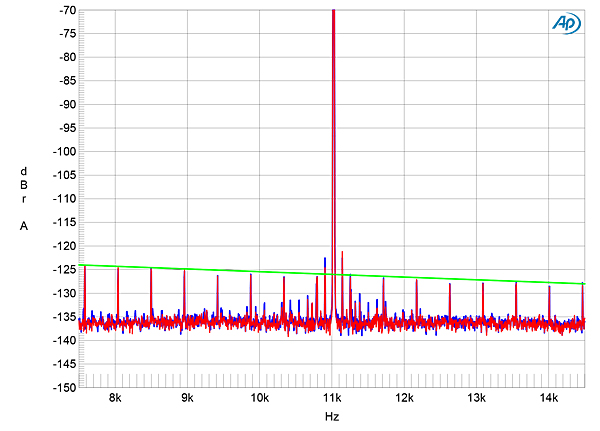
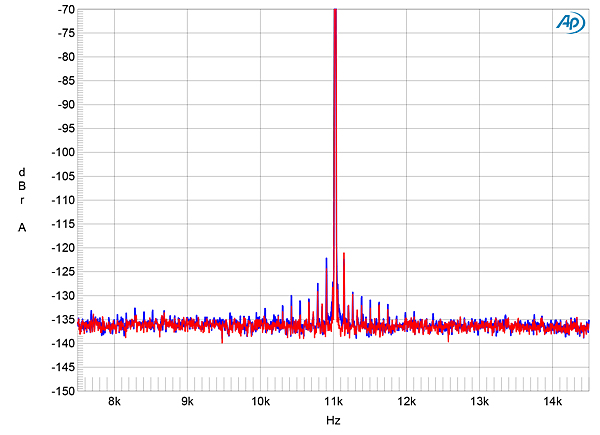
Intermodulation distortion via the digital inputs was even lower than it was via the analog inputs (fig.16), with the second-order difference product produced by equal-level tones at 19 and 20kHz with the combined waveform peaking at 0dBFS, lying at –93dB (0.0027%). Finally, tested for its rejection of word-clock jitter with 16-bit USB data, all the odd-order harmonics of the LSB-level, low-frequency square- wave were at the correct levels (fig.17, sloping green line). However, a pair of sidebands at ±120Hz to the sides of the peak that represents the high-level tone at one-quarter the sample rate can be seen, these power supply-related. Repeating the jitter test with TosLink data gave the same result, as did using 24-bit J-Test data (fig.18)
Fig.16 Krell K-300i, digital inputs, 24-bit data, HF intermodulation spectrum, DC–30kHz, 19+20kHz at 0dBFS into 100k ohms, 44.1kHz data (left channel blue, right red; linear frequency scale).
Fig.17 Krell K-300i, high-resolution jitter spectrum of analog output signal, 11.025kHz at –6dBFS, sampled at 44.1kHz with LSB toggled at 229Hz: 16-bit USB data sourced from MacBook Pro (left channel blue, right red). Center frequency of trace, 11.025kHz; frequency range, ±3.5kHz.
Fig.18 Krell K-300i, high-resolution jitter spectrum of analog output signal, 11.025kHz at –6dBFS, sampled at 44.1kHz with LSB toggled at 229Hz: 24-bit USB data sourced from MacBook Pro (left channel blue, right red). Center frequency of trace, 11.025kHz; frequency range, ±3.5kHz.


