Sidebar 3: Measurements
I used DRA Labs' MLSSA system and a calibrated DPA 4006 microphone to measure the JBL Stage A170's frequency response in the farfield, and an Earthworks QTC-40 mike for the nearfield responses. I left off the loudspeaker's grille for the measurements.
JBL specifies the A170's sensitivity as 89dB/2.83V/m, which is both higher than average and confirmed by my measurements. Props to JBL for an honest sensitivity specification. The impedance is specified as 6 ohms; while the solid trace in fig.1 shows that the impedance does drop below 6 ohms in the lower midrange and high treble, it is higher than that over much of the audioband. The minimum magnitude is 4.5 ohms between 190Hz and 210Hz, and though the electrical phase angle (dotted trace) is occasionally greater than 40°, the magnitude at those frequencies is relatively high. The JBL is not a difficult load for the partnering amplifier to drive.
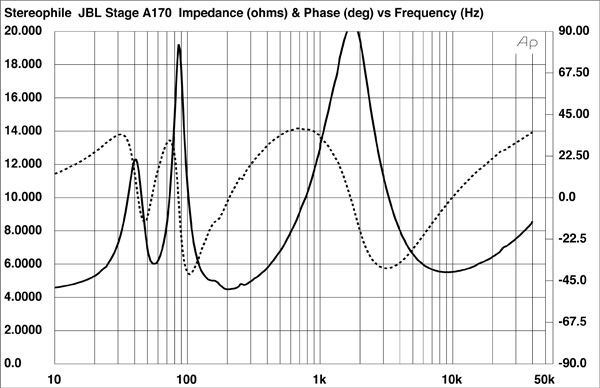
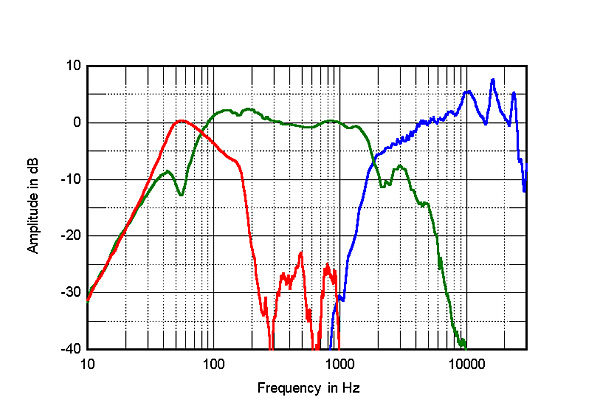 The impedance magnitude trace has a saddle centered on 55Hz,which implies that this is the tuning frequency of the two ports. The woofers' nearfield response does have its minimum-motion notch at 55Hz. This is the frequency at which the back pressure from the port resonance holds the cone stationary and is higher than I would have expected from a tower speaker with twin woofers. JBL describes the A170 as a "2.5-way" design with crossover frequencies of 1.8kHz and 2.8kHz. I assume from this that the upper woofer extends a little higher in frequency than the lower woofer. My measurements indicated that both woofers behave identically below 1kHz. However, the green trace in fig.3 suggests that the combined farfield output of the woofers (green trace) crosses over to the tweeter (blue trace) at 1.8kHz rather than 2.8kHz. Even so, the upper-frequency rolloff of the woofers is disturbed by a slight peak between 2.5kHz and 3.5kHz, which might be due to the upper woofer extending higher in frequency than the lower woofer.
Fig.3 shows that the tweeter's output starts to rise two octaves above the crossover frequency, and this can also be seen in the JBL's farfield response, averaged across a 30° horizontal window centered on the tweeter axis (fig.4). The A170's response is otherwise flat and even between 300Hz and 6kHz. The response with the grille was similar but with slightly more energy apparent between 4kHz and 9kHz, but there was a significant suckout centered on 3kHz. The grille will therefore both make the A170 sound a little polite and emphasize the excess energy in the top octaves. The trace below 300Hz in fig.4 shows the sum of the nearfield woofer and port outputs, taking into account acoustic phase and the different distance of each radiator from a nominal farfield microphone position.
The impedance magnitude trace has a saddle centered on 55Hz,which implies that this is the tuning frequency of the two ports. The woofers' nearfield response does have its minimum-motion notch at 55Hz. This is the frequency at which the back pressure from the port resonance holds the cone stationary and is higher than I would have expected from a tower speaker with twin woofers. JBL describes the A170 as a "2.5-way" design with crossover frequencies of 1.8kHz and 2.8kHz. I assume from this that the upper woofer extends a little higher in frequency than the lower woofer. My measurements indicated that both woofers behave identically below 1kHz. However, the green trace in fig.3 suggests that the combined farfield output of the woofers (green trace) crosses over to the tweeter (blue trace) at 1.8kHz rather than 2.8kHz. Even so, the upper-frequency rolloff of the woofers is disturbed by a slight peak between 2.5kHz and 3.5kHz, which might be due to the upper woofer extending higher in frequency than the lower woofer.
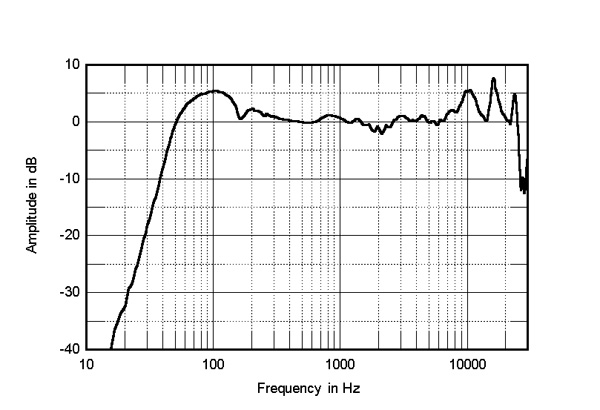
Fig.3 shows that the tweeter's output starts to rise two octaves above the crossover frequency, and this can also be seen in the JBL's farfield response, averaged across a 30° horizontal window centered on the tweeter axis (fig.4). The A170's response is otherwise flat and even between 300Hz and 6kHz. The response with the grille was similar but with slightly more energy apparent between 4kHz and 9kHz, but there was a significant suckout centered on 3kHz. The grille will therefore both make the A170 sound a little polite and emphasize the excess energy in the top octaves. The trace below 300Hz in fig.4 shows the sum of the nearfield woofer and port outputs, taking into account acoustic phase and the different distance of each radiator from a nominal farfield microphone position.
 The rise in response in the upper bass is due in part to the nearfield measurement technique but is disturbed by the ports' antiresonance I mentioned earlier. The low-frequency –6dB point, referenced to the level at 1kHz, lies at the specified 44Hz.
The JBL Stage A170's horizontal dispersion, with each trace normalized to the tweeter-axis response, is shown in fig.5. The contour lines in this graph are even in the midrange and low treble, implying stable stereo imaging, but the excess of top-octave energy in the on-axis output is maintained to the speaker's sides. In the vertical plane (fig.6), a suckout develops in the crossover region 15° above the tweeter axis, but the JBL's on-axis balance is otherwise preserved over a relatively wide window.
The rise in response in the upper bass is due in part to the nearfield measurement technique but is disturbed by the ports' antiresonance I mentioned earlier. The low-frequency –6dB point, referenced to the level at 1kHz, lies at the specified 44Hz.
The JBL Stage A170's horizontal dispersion, with each trace normalized to the tweeter-axis response, is shown in fig.5. The contour lines in this graph are even in the midrange and low treble, implying stable stereo imaging, but the excess of top-octave energy in the on-axis output is maintained to the speaker's sides. In the vertical plane (fig.6), a suckout develops in the crossover region 15° above the tweeter axis, but the JBL's on-axis balance is otherwise preserved over a relatively wide window.
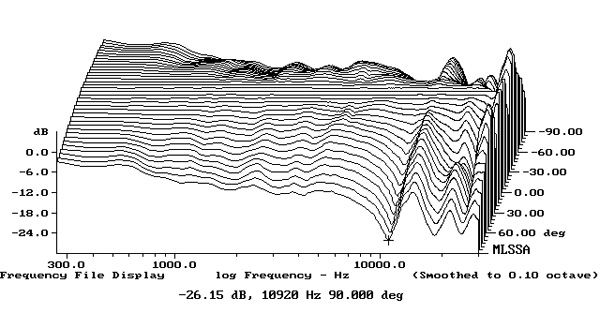
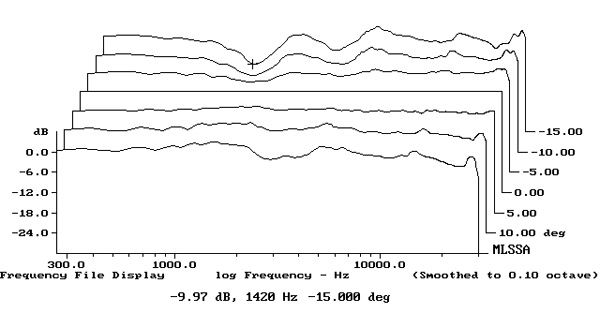
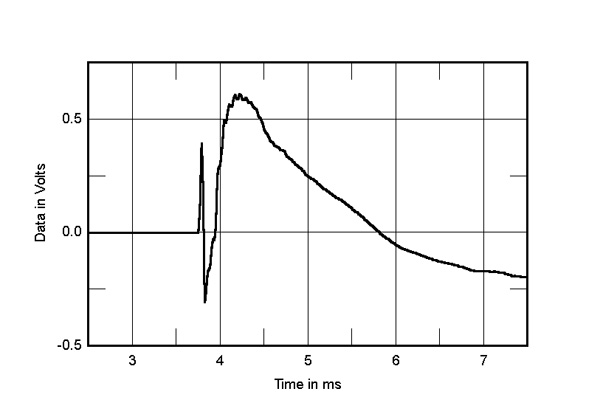
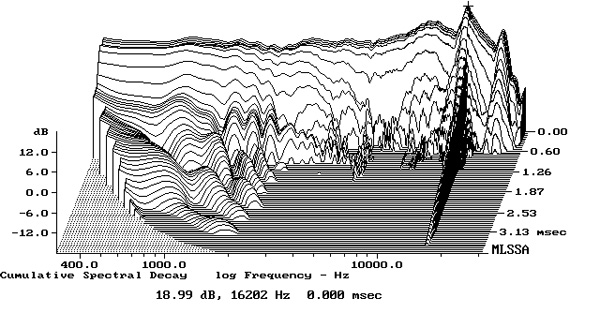
Fig.1 JBL Stage A170, electrical impedance (solid) and phase (dashed) (2 ohms/vertical div.).
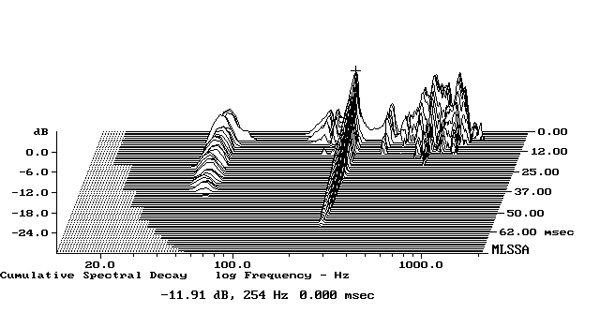
A small discontinuity between 200Hz and 300Hz in the impedance traces suggests there is some sort of resonance in that region. When I investigated the enclosure's vibrational behavior with a plastic-tape accelerometer, I found a high-level mode at 254Hz on all the enclosure's surfaces (fig.2). However, this mode has a high Q, meaning that it takes a while to be fully excited and possibly lead to audible congestion in the midrange.
Fig.2 JBL Stage A170, cumulative spectral-decay plot calculated from output of accelerometer fastened to center of sidewall level with lower woofer (MLS driving voltage to speaker, 7.55V; measurement bandwidth, 2kHz).
There is another discontinuity around 150Hz in the impedance graph. When I examined the outputs of the two woofers and two ports in the nearfield, I found a small suckout in the summed output of the woofers (fig.3, green trace) and a steeper-than-usual upper-frequency rolloff in the summed output of the two ports (red trace). This behavior suggests that there is some sort of antiresonance in the ports' outputs. (Both ports open into the same interior chamber.)
Fig.3 JBL Stage A170, acoustic crossover on tweeter axis at 50", corrected for microphone response, with nearfield woofer (green) and port (red) responses respectively plotted below 355Hz and 1kHz.
Fig.4 JBL Stage A170, anechoic response on tweeter axis at 50", averaged across 30° horizontal window and corrected for microphone response, with the complex sum of the nearfield woofer and port responses plotted below 300Hz.
Fig.5 JBL Stage A170, lateral response family at 50", normalized to response on tweeter axis, from back to front: differences in response 90–5° off axis, reference response, differences in response 5–90° off axis.
Fig.6 JBL Stage A170, vertical response family at 50", normalized to response on tweeter axis, from back to front: differences in response 15–5° above axis, reference response, differences in response 5–15° below axis.
In the time domain, the A170's step response on the tweeter axis (fig.7) indicates that the tweeter and woofers are all connected in positive acoustic polarity. The decay of the tweeter's step, which arrives first at the microphone, smoothly blends with the start of the woofers' step. This suggests optimal crossover implementation. The JBL's cumulative spectral-decay plot (fig.8) is clean overall, but there is a ridge of delayed energy associated with the on-axis response peak at 16.2kHz. This frequency is a couple of kHz higher than my high-frequency cutoff, but it may well be heard as a slight whistle by younger listeners.
Fig.7 JBL Stage A170, step response on tweeter axis at 50" (5ms time window, 30kHz bandwidth).
Fig.8 JBL Stage A170, cumulative spectral-decay plot on tweeter axis at 50" (0.15ms risetime).
To sum up, JBL's Stage A170 offers excellent measured performance, especially considering its affordable price.—John Atkinson