Sidebar 3: Measurements
The Dynaudio Confidence C1's sensitivity on its woofer axis, which is 37" from the floor, is both below the specification and below average, at an estimated 85dB(B)/2.83V/m. As Wes Phillips found in his auditioning, it will benefit from being driven by a powerful amplifier. As can be seen from fig.1, however, its impedance is relatively kind to the amplifier, though a dip to 4.3 ohms in the upper bass and a combination of 5.9 ohms magnitude and a –38° electrical phase angle suggest that tube amplifiers would work best with this speaker when used from their 4 ohm transformer taps.
The traces in fig.1 are free from any of the wrinkles that would suggest the presence of enclosure resonances, though I did find one on the sidewall at 477Hz (fig.2). This is low enough in level and high enough in frequency that it will probably have no audible consequences. What alarmed me more was a fairly strong resonance just above 500Hz in the two tubular metal pillars that comprise the stand to which the speaker is bolted (fig.3). Though the Q of this resonance is very high, which will work against its being excited by music, the stand does offer a fairly large radiating area. This resonance could be heard with a stethoscope while the speaker was playing pink noise; though WP noted no untoward effects using the Dynaudio stands au naturel, I strongly suggest that they be filled with dry sand or cat litter once the owner has decided on permanent positions for the speakers.
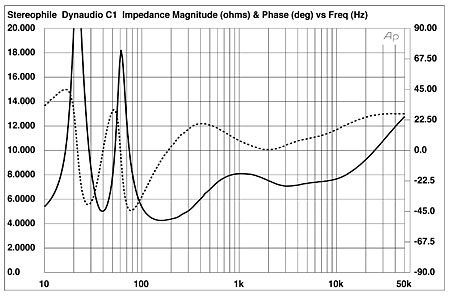 Fig.1 Dynaudio Confidence C1, electrical impedance (solid) and phase (dashed). (2 ohms/vertical div.)
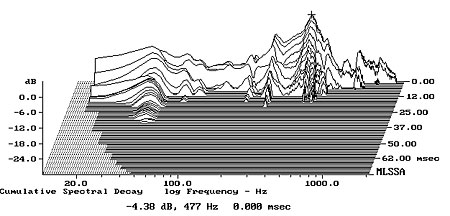 Fig.2 Dynaudio Confidence C1, cumulative spectral-decay plot calculated from the output of an accelerometer fastened to the center of the cabinet's side panel (MLS driving voltage to speaker, 7.55V; measurement bandwidth, 2kHz).
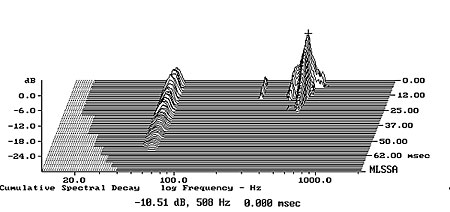 Fig.3 Dynaudio Confidence C1, cumulative spectral-decay plot calculated from the output of an accelerometer fastened to the center of one of the stand's pillars (MLS driving voltage to speaker, 7.55V; measurement bandwidth, 2kHz).
Turning to the Confidence C1's acoustic performance, its farfield anechoic response, averaged across a 30° horizontal angle on the woofer axis, is impressively flat and extended (fig.4, black trace above 300Hz). The traces below 300Hz in this graph were taken in the nearfield and show the output of the woofer (blue), reflex port (red), and their sum (black), the last taking into account both acoustic phase and the different distances of the woofer and port from a nominal farfield measuring point. This doesn't feature the usual nearfield bump in the upper and midbass regions, which suggests that the C1's bass alignment is somewhat overdamped, optimized for clarity and definition rather than bass weight. Even so, the speaker's output extends to below 40Hz, which WP found more than adequate, even in his larger room. The woofer's output (blue) features the reflex minimum-motion notch at 41Hz, the center frequency of the low-frequency "saddle" in the impedance magnitude trace—this is the frequency where the back pressure from the port resonance holds the woofer cone motionless. The port's output (red) neatly covers the octave bandpass between 30 and 60Hz, but a couple of small peaks can be seen in its upper-band response. The fact that the port faces away from the listener will reduce the audibility of these modes.
Fig.3 Dynaudio Confidence C1, cumulative spectral-decay plot calculated from the output of an accelerometer fastened to the center of one of the stand's pillars (MLS driving voltage to speaker, 7.55V; measurement bandwidth, 2kHz).
Turning to the Confidence C1's acoustic performance, its farfield anechoic response, averaged across a 30° horizontal angle on the woofer axis, is impressively flat and extended (fig.4, black trace above 300Hz). The traces below 300Hz in this graph were taken in the nearfield and show the output of the woofer (blue), reflex port (red), and their sum (black), the last taking into account both acoustic phase and the different distances of the woofer and port from a nominal farfield measuring point. This doesn't feature the usual nearfield bump in the upper and midbass regions, which suggests that the C1's bass alignment is somewhat overdamped, optimized for clarity and definition rather than bass weight. Even so, the speaker's output extends to below 40Hz, which WP found more than adequate, even in his larger room. The woofer's output (blue) features the reflex minimum-motion notch at 41Hz, the center frequency of the low-frequency "saddle" in the impedance magnitude trace—this is the frequency where the back pressure from the port resonance holds the woofer cone motionless. The port's output (red) neatly covers the octave bandpass between 30 and 60Hz, but a couple of small peaks can be seen in its upper-band response. The fact that the port faces away from the listener will reduce the audibility of these modes.
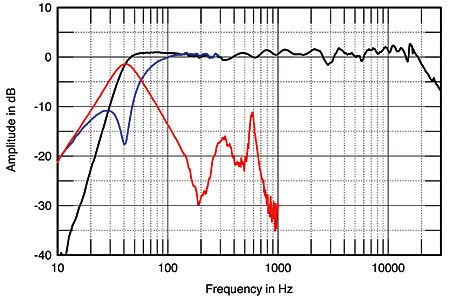 Fig.4 Dynaudio Confidence C1, anechoic response on woofer axis at 50", averaged across 30° horizontal window and corrected for microphone response, with the nearfield responses of the port (red) and woofer (blue) plotted below 1kHz and 300Hz, respectively, and the complex sum of the nearfield responses plotted below 300Hz (black).
The Confidence C1's impressively flat on-axis anechoic response doesn't necessarily mean that its perceived balance in-room will also be flat, as this will also depend on the speaker's radiation pattern. The C1's horizontal dispersion is shown in fig.5. (The on-axis response has been subtracted from those off axis in this graph, which means that it appears to be a straight line, which is not too far from the truth!) The woofer's output falls off to the speaker's sides in the top two octaves of its passband, with then a flare apparent at the bottom of the tweeter's range. The tweeter itself becomes quite directional above 8kHz. In the vertical plane (fig.6), the balance doesn't change over quite a wide angle, although a suckout does appear in the crossover region more than 5° above the woofer axis.
Fig.4 Dynaudio Confidence C1, anechoic response on woofer axis at 50", averaged across 30° horizontal window and corrected for microphone response, with the nearfield responses of the port (red) and woofer (blue) plotted below 1kHz and 300Hz, respectively, and the complex sum of the nearfield responses plotted below 300Hz (black).
The Confidence C1's impressively flat on-axis anechoic response doesn't necessarily mean that its perceived balance in-room will also be flat, as this will also depend on the speaker's radiation pattern. The C1's horizontal dispersion is shown in fig.5. (The on-axis response has been subtracted from those off axis in this graph, which means that it appears to be a straight line, which is not too far from the truth!) The woofer's output falls off to the speaker's sides in the top two octaves of its passband, with then a flare apparent at the bottom of the tweeter's range. The tweeter itself becomes quite directional above 8kHz. In the vertical plane (fig.6), the balance doesn't change over quite a wide angle, although a suckout does appear in the crossover region more than 5° above the woofer axis.
 Fig.5 Dynaudio Confidence C1, lateral response family at 50", normalized to response on woofer axis, from back to front: differences in response 90–5° off axis, reference response, differences in response 5–90° off axis.
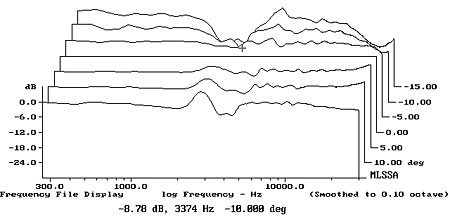 Fig.6 Dynaudio Confidence C1, vertical response family at 50", normalized to response on woofer axis, from back to front: differences in response 15–5° above axis, reference response, differences in response 5–15° below axis.
Fig.7 shows how the Confidence C1's on-axis output and horizontal and vertical radiation patterns add up in WP's listening room. To produce this graph, I averaged 40 measurements taken for each speaker individually in a rectangular grid centered on the position of Wes's ears in his listening seat. I used Fuzzmeasure running on my Mac laptop, in conjunction with an EarthWorks omni mike and a Metric Halo MIO2882 FireWire sound processor.
Fig.6 Dynaudio Confidence C1, vertical response family at 50", normalized to response on woofer axis, from back to front: differences in response 15–5° above axis, reference response, differences in response 5–15° below axis.
Fig.7 shows how the Confidence C1's on-axis output and horizontal and vertical radiation patterns add up in WP's listening room. To produce this graph, I averaged 40 measurements taken for each speaker individually in a rectangular grid centered on the position of Wes's ears in his listening seat. I used Fuzzmeasure running on my Mac laptop, in conjunction with an EarthWorks omni mike and a Metric Halo MIO2882 FireWire sound processor.
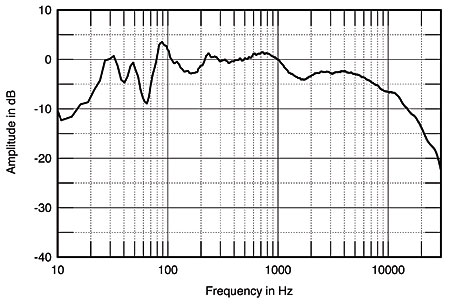 Fig.7 Dynaudio Confidence C1, spatially averaged, 1/6-octave response in WP's listening room.
Despite the C1's flat anechoic response, Wes sits far enough away—4.5m, or nearly 15'—that the speaker's dispersion dominates the measured in-room response at the listening chair. The woofer's directionality at the top of its passband results in a shelved-down output above 1kHz, relieved by the tweeter's wider dispersion between 2 and 5kHz. The balance slopes down in the top two octaves due both to the tweeter's increasing directionality in this region and the increased absorption of the sound by the room furnishings at high frequencies. This does not mean the perceived balance will be rolled off, as the ear tends to discriminate between the direct sound from the speakers and the room's reverberant field. But this graph does suggest that the Confidence C1 will tend to sound mellow rather than bright in all but small rooms. At low frequencies, the spatial averaging hasn't totally eliminated the effects of the resonances in WP's room, which has minimal acoustic treatment. But the speaker's output is strong down to just below 30Hz, which is excellent extension given the speaker's fairly small footprint.
In the time domain, the C1's step response on the woofer axis (fig.8) indicates that both drive-units are connected with positive acoustic polarity and that the tweeter's output still leads that of the woofer on this axis. However, the former smoothly hands over to the latter, correlating with the good frequency-domain integration in the crossover region seen in fig.4. The cumulative spectral-decay plot on the woofer axis (fig.9) is superbly clean, suggesting that the Confidence C1's treble will be smooth and free of grain.
Fig.7 Dynaudio Confidence C1, spatially averaged, 1/6-octave response in WP's listening room.
Despite the C1's flat anechoic response, Wes sits far enough away—4.5m, or nearly 15'—that the speaker's dispersion dominates the measured in-room response at the listening chair. The woofer's directionality at the top of its passband results in a shelved-down output above 1kHz, relieved by the tweeter's wider dispersion between 2 and 5kHz. The balance slopes down in the top two octaves due both to the tweeter's increasing directionality in this region and the increased absorption of the sound by the room furnishings at high frequencies. This does not mean the perceived balance will be rolled off, as the ear tends to discriminate between the direct sound from the speakers and the room's reverberant field. But this graph does suggest that the Confidence C1 will tend to sound mellow rather than bright in all but small rooms. At low frequencies, the spatial averaging hasn't totally eliminated the effects of the resonances in WP's room, which has minimal acoustic treatment. But the speaker's output is strong down to just below 30Hz, which is excellent extension given the speaker's fairly small footprint.
In the time domain, the C1's step response on the woofer axis (fig.8) indicates that both drive-units are connected with positive acoustic polarity and that the tweeter's output still leads that of the woofer on this axis. However, the former smoothly hands over to the latter, correlating with the good frequency-domain integration in the crossover region seen in fig.4. The cumulative spectral-decay plot on the woofer axis (fig.9) is superbly clean, suggesting that the Confidence C1's treble will be smooth and free of grain.
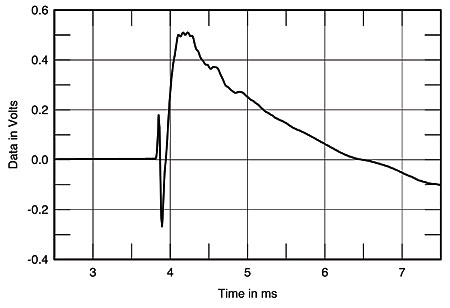 Fig.8 Dynaudio Confidence C1, step response on woofer axis at 50" (5ms time window, 30kHz bandwidth).
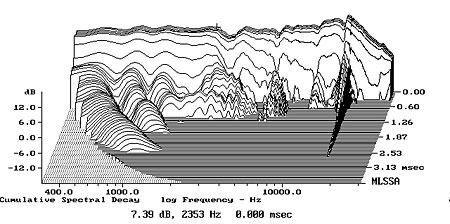 Fig.9 Dynaudio Confidence C1, cumulative spectral-decay plot at 50" (0.15ms risetime).
This superb measured performance is beyond reproach (other than that lively stand).—John Atkinson
Fig.9 Dynaudio Confidence C1, cumulative spectral-decay plot at 50" (0.15ms risetime).
This superb measured performance is beyond reproach (other than that lively stand).—John Atkinson
Fig.1 Dynaudio Confidence C1, electrical impedance (solid) and phase (dashed). (2 ohms/vertical div.)
Fig.2 Dynaudio Confidence C1, cumulative spectral-decay plot calculated from the output of an accelerometer fastened to the center of the cabinet's side panel (MLS driving voltage to speaker, 7.55V; measurement bandwidth, 2kHz).
Fig.3 Dynaudio Confidence C1, cumulative spectral-decay plot calculated from the output of an accelerometer fastened to the center of one of the stand's pillars (MLS driving voltage to speaker, 7.55V; measurement bandwidth, 2kHz).
Turning to the Confidence C1's acoustic performance, its farfield anechoic response, averaged across a 30° horizontal angle on the woofer axis, is impressively flat and extended (fig.4, black trace above 300Hz). The traces below 300Hz in this graph were taken in the nearfield and show the output of the woofer (blue), reflex port (red), and their sum (black), the last taking into account both acoustic phase and the different distances of the woofer and port from a nominal farfield measuring point. This doesn't feature the usual nearfield bump in the upper and midbass regions, which suggests that the C1's bass alignment is somewhat overdamped, optimized for clarity and definition rather than bass weight. Even so, the speaker's output extends to below 40Hz, which WP found more than adequate, even in his larger room. The woofer's output (blue) features the reflex minimum-motion notch at 41Hz, the center frequency of the low-frequency "saddle" in the impedance magnitude trace—this is the frequency where the back pressure from the port resonance holds the woofer cone motionless. The port's output (red) neatly covers the octave bandpass between 30 and 60Hz, but a couple of small peaks can be seen in its upper-band response. The fact that the port faces away from the listener will reduce the audibility of these modes.
Fig.4 Dynaudio Confidence C1, anechoic response on woofer axis at 50", averaged across 30° horizontal window and corrected for microphone response, with the nearfield responses of the port (red) and woofer (blue) plotted below 1kHz and 300Hz, respectively, and the complex sum of the nearfield responses plotted below 300Hz (black).
Fig.5 Dynaudio Confidence C1, lateral response family at 50", normalized to response on woofer axis, from back to front: differences in response 90–5° off axis, reference response, differences in response 5–90° off axis.
Fig.6 Dynaudio Confidence C1, vertical response family at 50", normalized to response on woofer axis, from back to front: differences in response 15–5° above axis, reference response, differences in response 5–15° below axis.
Fig.7 Dynaudio Confidence C1, spatially averaged, 1/6-octave response in WP's listening room.
Despite the C1's flat anechoic response, Wes sits far enough away—4.5m, or nearly 15'—that the speaker's dispersion dominates the measured in-room response at the listening chair. The woofer's directionality at the top of its passband results in a shelved-down output above 1kHz, relieved by the tweeter's wider dispersion between 2 and 5kHz. The balance slopes down in the top two octaves due both to the tweeter's increasing directionality in this region and the increased absorption of the sound by the room furnishings at high frequencies. This does not mean the perceived balance will be rolled off, as the ear tends to discriminate between the direct sound from the speakers and the room's reverberant field. But this graph does suggest that the Confidence C1 will tend to sound mellow rather than bright in all but small rooms. At low frequencies, the spatial averaging hasn't totally eliminated the effects of the resonances in WP's room, which has minimal acoustic treatment. But the speaker's output is strong down to just below 30Hz, which is excellent extension given the speaker's fairly small footprint.
In the time domain, the C1's step response on the woofer axis (fig.8) indicates that both drive-units are connected with positive acoustic polarity and that the tweeter's output still leads that of the woofer on this axis. However, the former smoothly hands over to the latter, correlating with the good frequency-domain integration in the crossover region seen in fig.4. The cumulative spectral-decay plot on the woofer axis (fig.9) is superbly clean, suggesting that the Confidence C1's treble will be smooth and free of grain.
Fig.8 Dynaudio Confidence C1, step response on woofer axis at 50" (5ms time window, 30kHz bandwidth).
Fig.9 Dynaudio Confidence C1, cumulative spectral-decay plot at 50" (0.15ms risetime).
This superb measured performance is beyond reproach (other than that lively stand).—John Atkinson