Sidebar 3: Measurements
I measured the CH Precision I1 Universal amplifier with my Audio Precision SYS2722 system (see the January 2008 "As We See It"). Before performing any testing, I connected the amplifier's Ethernet port to my network, then ran it at one-third power into 8 ohms. At the end of that period its top panel was warm, at 107.8°F (42.1°C), and the front-panel display indicated that the internal temperature was 63°C (145.4°F). (This panel is very useful—as well as temperature, it indicates volume, the input settings, and when the amplifier is clipping. It also allows the menu to be navigated, as does the CH Android app.)
I wasn't able to test the CH I1's phono stage because its current-mode input didn't appear to be compatible with the Audio Precision's voltage-mode output. Looking first at the line-level analog inputs: With the volume control at its maximum setting—the default setting is "0dB," though additional gain up to 24dB can be selected for each input via the menu—the voltage gain at 1kHz into 8 ohms from the speaker terminals measured a low 22.53dB for the balanced input but 29dB for the unbalanced inputs. (Usually, a balanced input offers 6dB more gain than an unbalanced input, not 6dB less.) The line inputs preserved absolute polarity (ie, were non-inverting) from all outputs. The unbalanced input impedance was 44k ohms at low and middle frequencies, dropping to 23k ohms at 20kHz. As expected, the balanced input impedance was twice the unbalanced value. The preamplifier output offered an insertion loss of 0.7dB, with an appropriately low output impedance of 72 ohms across the audioband.
The output impedance at the speaker terminals (including cables) varied according to the amount of global negative feedback selected with the menu. With global negative feedback set to 100%, the output impedance was 0.11 ohm at 20Hz and 1kHz, rising slightly to 0.15 ohm at 20kHz. As a result, the modulation of the I1's frequency response with our standard simulated loudspeaker was just ±0.1dB (fig.1, gray trace). Reducing the feedback level to 60% increased the impedance to 0.23 ohm at 20Hz and 1kHz, 0.27 ohm at 20kHz. With 40% feedback, the respective impedances were 0.3 and 0.32 ohm. With no global feedback, the impedance was 0.40 ohm at 20Hz and 1kHz, 0.44 ohm at 20kHz, and the modulation of the frequency response was now ±0.2dB (fig.2, gray trace).

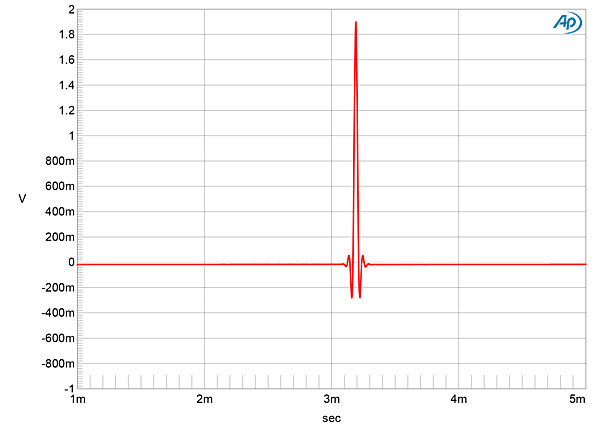
 The CH's impulse response with 44.1kHz data (fig.18) indicates that its reconstruction filter is a very short linear-phase type, with just a couple of cycles of ringing to either side of the single sample at 0dBFS. The manual says that the I1's reconstruction filter can be set to linear phase or minimum phase. However, neither the front-panel display nor the Android app offered a menu item for switching between the two reconstruction filters. Perhaps this choice will be the subject of a firmware update.
 Intermodulation distortion via the I1s' digital inputs was extremely low (fig.24). When I tested the digital inputs' rejection of word-clock jitter with 16-bit J-Test data, the odd-order harmonics of the LSB-level, low-frequency squarewave were all at the correct levels (fig.25, sloping green line), with no other sidebands visible. There were no sidebands visible with 24-bit J-Test data (fig.26).
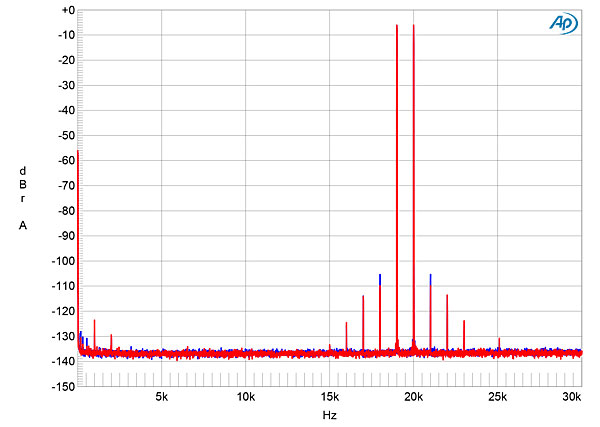
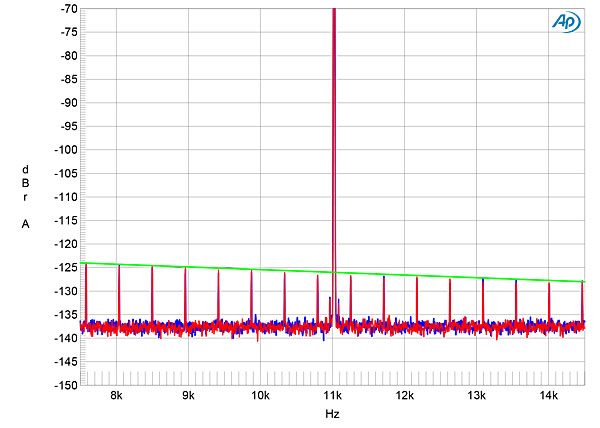
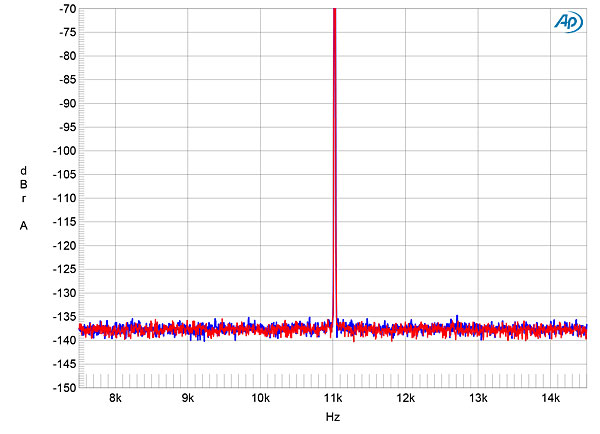
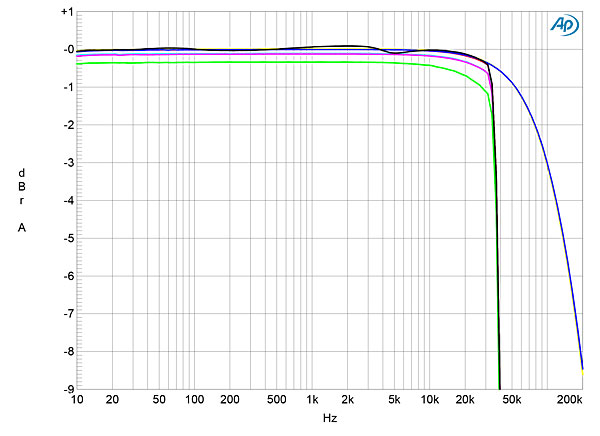
Fig.1 CH Precision I1, analog input, 100% feedback, volume control at max, digitized frequency response at 2.83V into: simulated loudspeaker load (gray), 8 ohms (left channel blue, right red), 4 ohms (left cyan, right magenta), 2 ohms (green); Bypass frequency response at 2.83V into 8 ohms (left blue, right, yellow) (1dB/vertical div.).
Fig.2 CH Precision I1, analog input, 0% feedback, volume control at max, digitized frequency response at 2.83V into: simulated loudspeaker load (gray), 8 ohms (left channel blue, right red), 4 ohms (left cyan, right magenta), 2 ohms (green) (1dB/vertical div.).
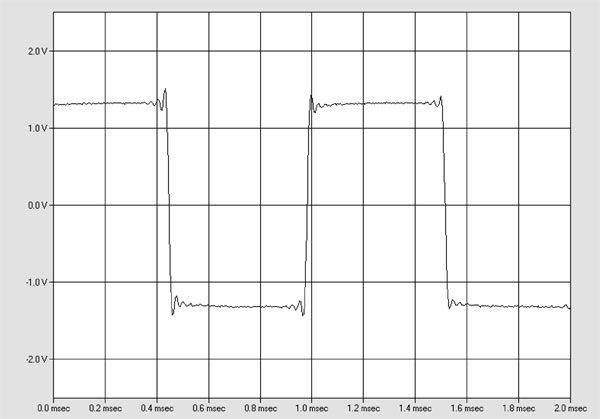
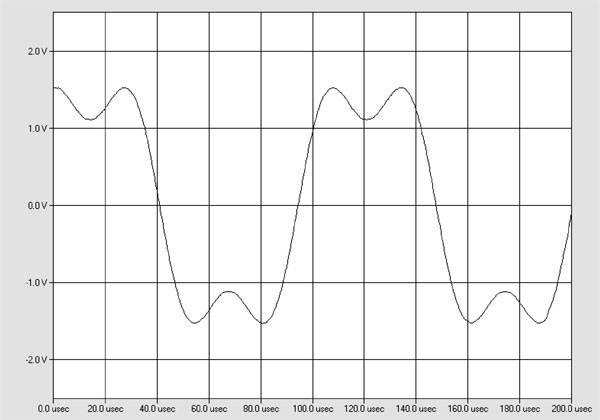
An unusual aspect of these two response graphs is that the amplifier's output drops sharply above 35kHz. I had understood that in Normal mode, the I1 digitizes its analog line inputs at 384kHz—but figs. 1 and 2 suggest that the sample rate is actually 88.2 or 96kHz. There is nothing in the manual about changing the sample rate for the analog inputs, nor do the front-panel or Android-tablet setup menus offer options for this. I did wonder if the sample rate was somehow affected by that of the data present at the digital inputs; however, even with, for example, the AES/EBU input receiving 192kHz data, the analog digitizing sampling remained at the lower rate. When I set the balanced input to Bypass, which eliminates the digitizing (and the volume control), I got the frequency response shown as the blue and yellow traces in fig.1. It extends significantly higher in frequency, not reaching –3dB until 100kHz. (Fortunately, Jason's comparisons with the dCS Rossini were performed with the I1 in Bypass mode.) In Normal mode, the digitization affects the shapes of 1kHz (fig.3) and 10kHz (fig.4) squarewaves.
Fig.3 CH Precision I1, analog input, small-signal, 1kHz squarewave into 8 ohms.
Fig.4 CH Precision I1, analog input, small-signal, 10kHz squarewave into 8 ohms.
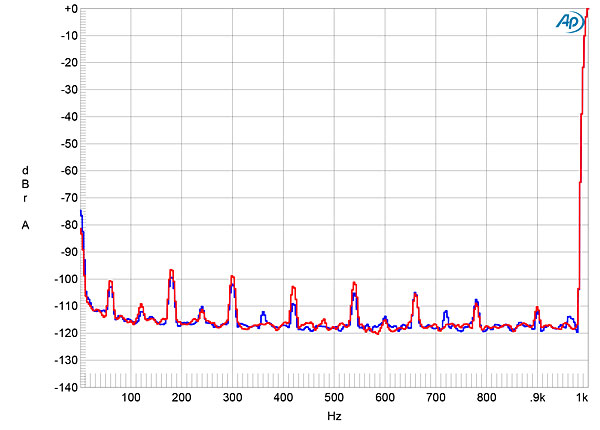
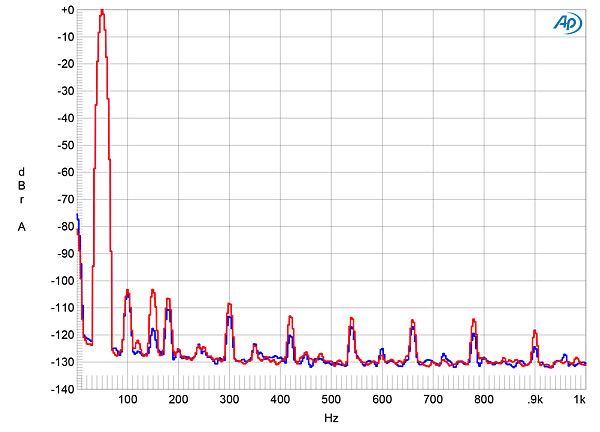
Channel separation was excellent, at >110dB in both directions below 2kHz, decreasing to 80dB at 20kHz. With the analog inputs shorted to ground and the volume control set to its maximum, the wideband, unweighted signal/noise ratio (ref. 2.83V into 8 ohms) measured 62.6dB in both channels. Restricting the measurement bandwidth to 22kHz increased the ratio to 83.3dB, and an A-weighting filter increased it further, to 86.0dB. Levels of residual spuriae at the AC power-line frequency and its odd-order harmonics, presumably due to magnetic coupling from the massive power transformer, were very low (fig.5).
Fig.5 CH Precision I1, analog input, spectrum of 1kHz sinewave, DC–1kHz, at 1W into 8 ohms (left channel blue, right red; linear frequency scale).
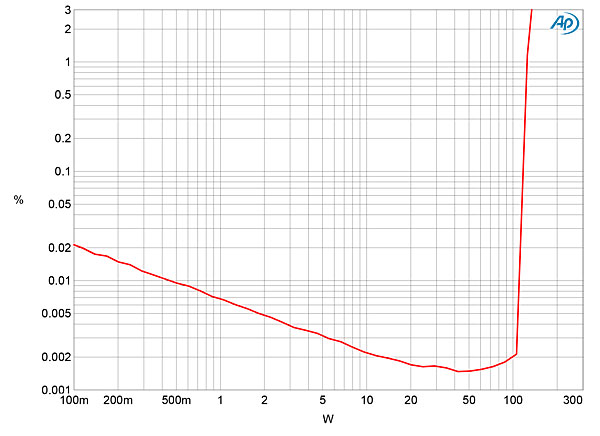
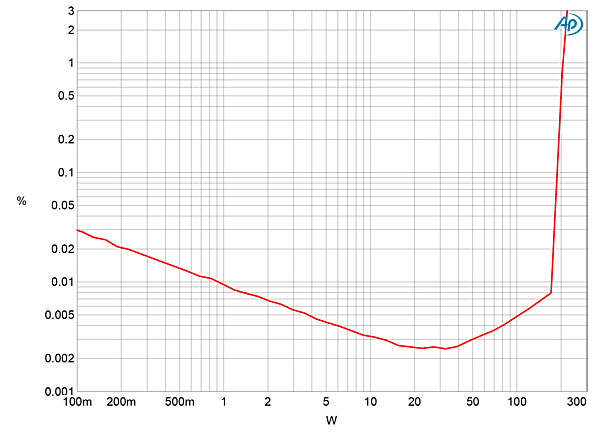
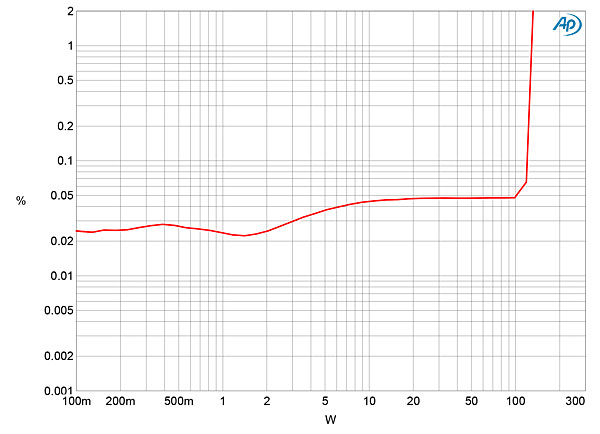
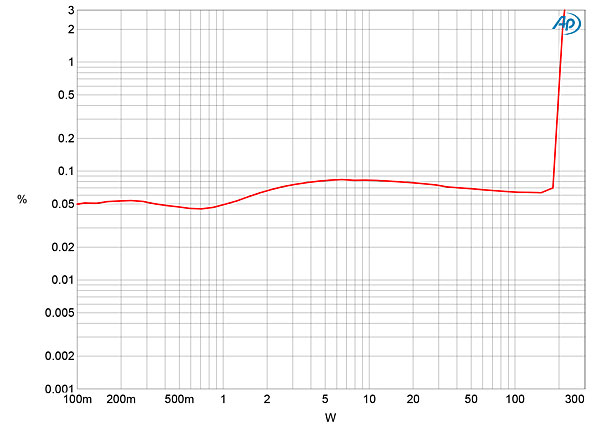
CH Precision specifies the I1 as delivering a maximum continuous output power of 100Wpc into 8 ohms (20dBW). At our usual definition of clipping (ie, when the percentage of THD+noise in the amplifier's output reaches 1%), with continuous drive in both channels, the CH exceeded that spec, delivering 120Wpc into 8 ohms (fig.6, 20.8dBW). With both channels driven into 4 ohms (fig.7), the I1 clipped at 210W (20.2dBW), compared with the specified power into this load of 175Wpc (19.4dBW). Fig.6 was taken with 100% global feedback; the actual distortion is below the noise floor until the power reaches 50W or so. Repeating the 8 and 4 ohm tests with 0% feedback gave the same clipping power, but with about 20 times higher distortion below clipping (figs.8 & 9).
Fig.6 CH Precision I1, analog input, 100% feedback, distortion (%) vs 1kHz continuous output power into 8 ohms, both channels driven.
Fig.7 CH Precision I1, analog input, 100% feedback, distortion (%) vs 1kHz continuous output power into 4 ohms, both channels driven.
Fig.8 CH Precision I1, analog input, 0% feedback, distortion (%) vs 1kHz continuous output power into 8 ohms, both channels driven.
Fig.9 CH Precision I1, analog input, 0% feedback, distortion (%) vs 1kHz continuous output power into 4 ohms, both channels driven.
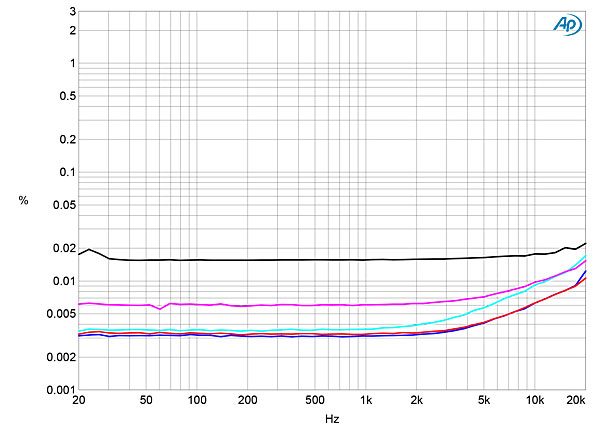
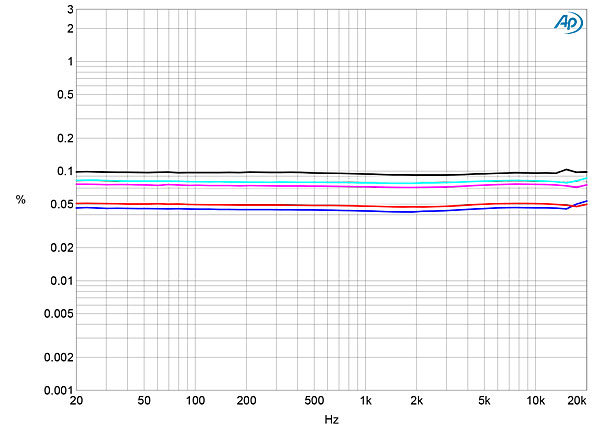
With the amplifier set to 100% feedback, I measured its THD+N percentage against frequency at a level of 12.65V, which is equivalent to 20W into 8 ohms, 40W into 4 ohms, and 80W into 2 ohms. The distortion levels were low even into 2 ohms (fig.10, gray trace), and, perhaps more important, didn't rise by much at higher frequencies. This was also true when the I1 was set to 0% feedback, though the distortion levels were again around 20 times higher (fig.11).
Fig.10 CH Precision I1, analog input, 100% feedback, distortion (%) vs frequency at 12.65V into: 8 ohms (left channel blue, right red), 4 ohms (left cyan, right magenta), 2 ohms (gray).
Fig.11 CH Precision I1, analog input, 0% feedback, distortion (%) vs frequency at 12.65V into: 8 ohms (left channel blue, right red), 4 ohms (left cyan, right magenta), 2 ohms (gray).
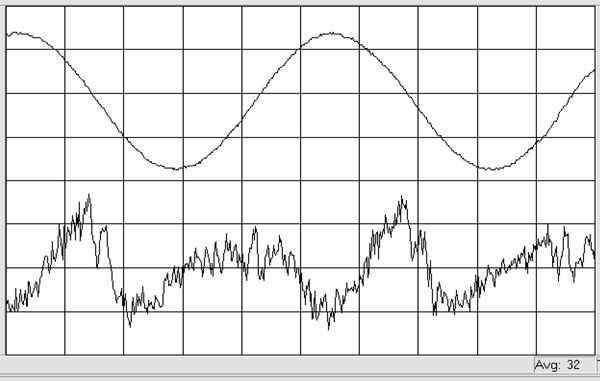
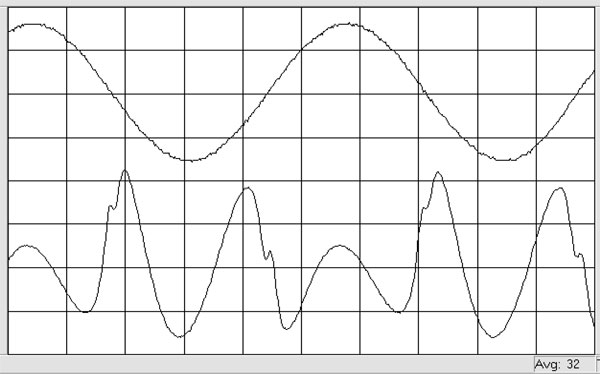
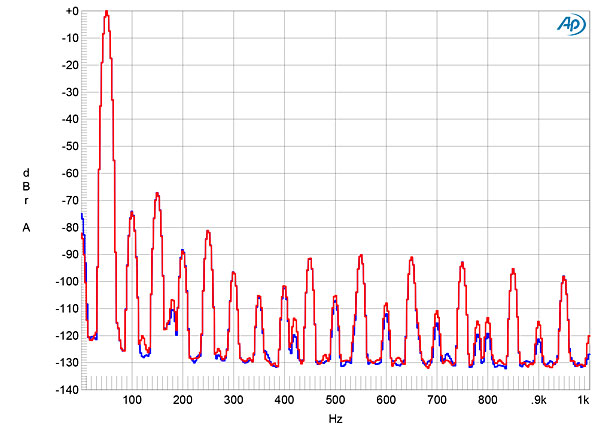
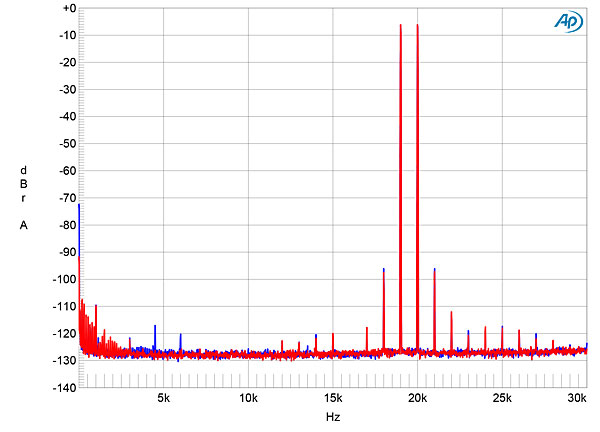
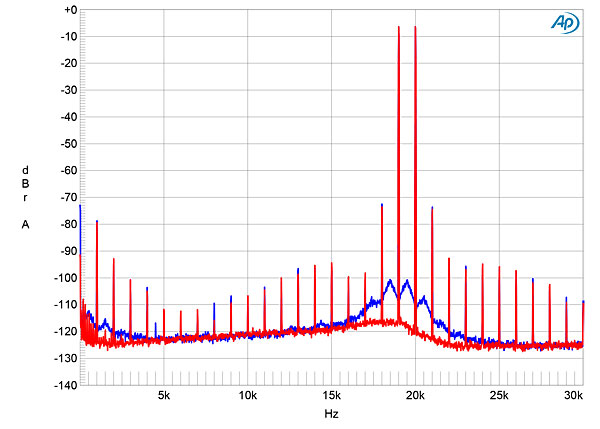
The shapes of the distortion-spuriae waveforms (fig.12, 100% feedback; fig.13, 0% feedback) suggest that the third harmonic was the highest in level, but with higher-order harmonics present with zero feedback. Spectral analysis indicated that with 100% feedback the second and third harmonics were equal in level, though at –104dB (0.0006%) both are negligible (fig.14). With 0% feedback, the higher-order harmonics are present at much higher levels (fig.15). Both second-order and higher-order intermodulation products at 20Wpc into 8 ohms with 100% feedback were negligible (fig.16). All the IM products increased as I reduced the feedback level, and with 0% feedback the second-order product reached a still-low –80dB (0.01%) (fig.17).
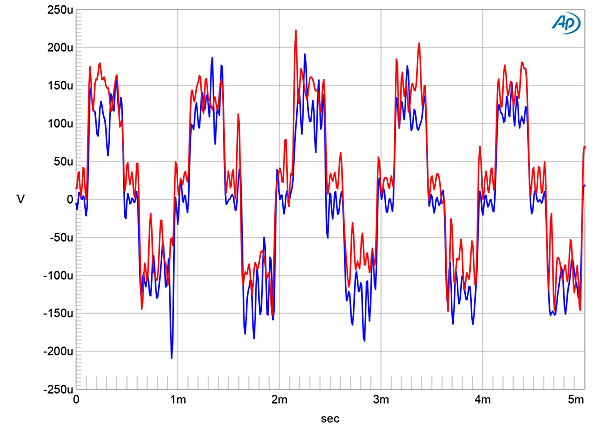
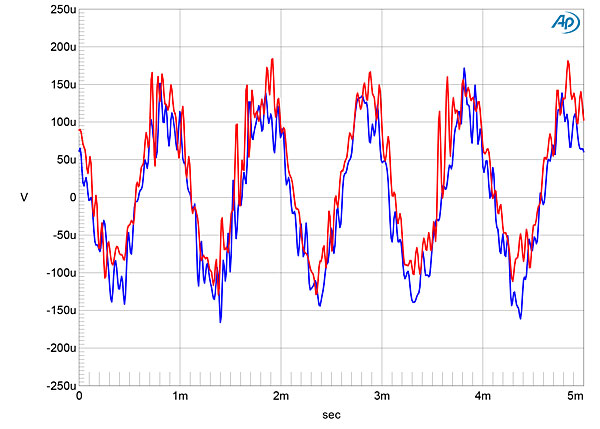
Fig.12 CH Precision I1, analog input, 100% feedback, 1kHz waveform at 40W into 8 ohms, 0.0024% THD+N (top); distortion and noise waveform with fundamental notched out (bottom, not to scale).
Fig.13 CH Precision I1, analog input, 0% feedback, 1kHz waveform at 40W into 8 ohms, 0.048% THD+N (top); distortion and noise waveform with fundamental notched out (bottom, not to scale).
Fig.14 CH Precision I1, analog input, 100% feedback, spectrum of 50Hz sinewave, DC–1kHz, at 20Wpc into 8 ohms (left channel blue, right red; linear frequency scale).
Fig.15 CH Precision I1, analog input, 0% feedback, spectrum of 50Hz sinewave, DC–1kHz, at 20Wpc into 8 ohms (left channel blue, right red; linear frequency scale).
Fig.16 CH Precision I1, analog input, 100% feedback, HF intermodulation spectrum, DC–30kHz, 19+20kHz at 20Wpc peak into 8 ohms (left channel blue, right red; linear frequency scale).
Fig.17 CH Precision I1, analog input, 0% feedback, HF intermodulation spectrum, DC–30kHz, 19+20kHz at 20Wpc peak into 8 ohms (left channel blue, right red; linear frequency scale).
Turning to the digital inputs, the I1's's AES/EBU and coaxial S/PDIF inputs locked to datastreams with all sample rates up to 192kHz. The optical input topped out at 96kHz. All digital inputs preserved absolute polarity. Apple's USB Prober utility identified the I1 as "CH Precision USB Audio 2.0" from "CH Precision," and confirmed that its USB port operated in the optimal isochronous asynchronous mode. The AudioMIDI utility revealed that the I1's USB port could handle 16- and 24-bit integer data at all sample rates up to 384kHz. With the volume control set to its normal maximum of "0dB," a 1kHz digital signal at –12dBFS resulted in output levels of 1.36V at the balanced preamp outputs and 20.55V into 8 ohms at the speaker outputs. The front-panel display indicated that the amplifier was clipping with digital data higher in level than –11dBFS. Therefore, I continued testing the digital inputs from the balanced preamplifier outputs with the volume control set to "–12dB."
Fig.18 CH Precision I1, digital input, impulse response (one sample at 0dBFS, 44.1kHz sampling, 4ms time window).
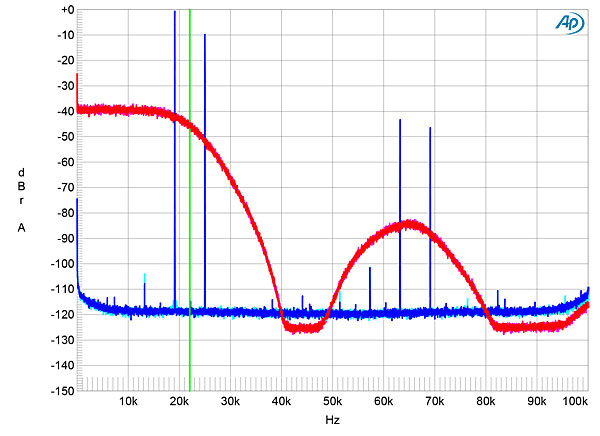
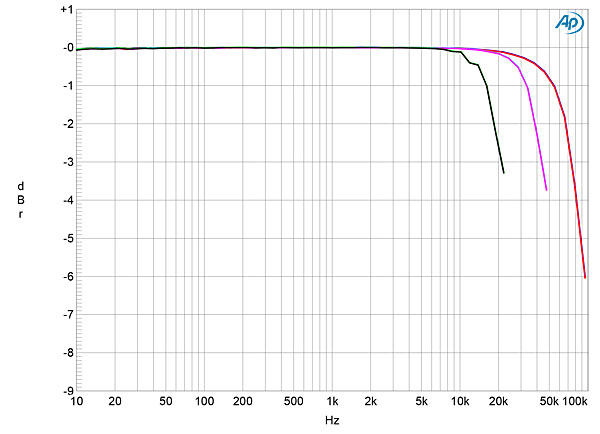
With 44.1kHz-sampled white noise upsampled to 352.8kHz (fig.19, red and magenta traces), the I1's response rolled off slowly above the audioband, not reaching full stop-band suppression until an octave above the Nyquist frequency of 22.05kHz (vertical green line). The aliased image at 25kHz of a full-scale tone at 19.1kHz (blue and cyan traces) is suppressed by only 10dB, though almost no other aliasing products are present. The CH Precision's digital frequency response with AES/EBU data at 44.1, 96, and 192kHz followed the same basic shape at each sample rate, with a slow rolloff that reached –3dB at 20kHz with 44.1kHz data (fig.20, green and gray traces). Some passband ripples present in the top audio octave with 44.1kHz data are absent at the higher sample rates.
Fig.19 CH Precision I1, digital input, wideband spectrum of white noise at –4dBFS (left channel red, right magenta) and 19.1kHz tone at 0dBFS (left blue, right cyan), with data sampled at 44.1kHz (20dB/vertical div.).
Fig.20 CH Precision I1, digital input, frequency response at –12dBFS into 100k ohms with data sampled at: 44.1kHz (left channel green, right gray), 96kHz (left cyan, right magenta), 192kHz (left blue, right red) (1dB/vertical div.).
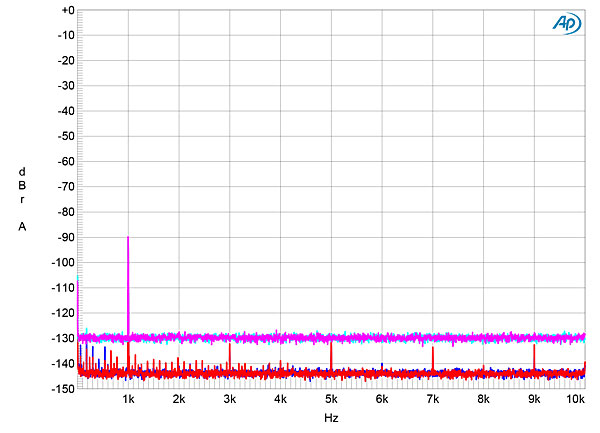
When I increased the bit depth from 16 to 24 with a dithered 1kHz tone at –90dBFS (fig.21), the noise floor dropped by about 15dB, meaning that the I1 offers between 17 and 18 bits' worth of resolution. With undithered data representing a tone at exactly –90.31dBFS (fig.22), the three DC voltage levels described by the data were well resolved and the waveform was perfectly symmetrical, though some HF noise was present. With undithered 24-bit data, the result was a slightly noisy sinewave (fig.23).
Fig.21 CH Precision I1, digital input, spectrum with noise and spuriae of dithered 1kHz tone at –90dBFS with: 16-bit data (left channel cyan, right magenta), 24-bit data (left blue, right red) (20dB/vertical div.).
Fig.22 CH Precision I1, digital input, waveform of undithered 1kHz sinewave at –90.31dBFS, 16-bit data (left channel blue, right red).
Fig.23 CH Precision I1, digital input, waveform of undithered 1kHz sinewave at –90.31dBFS, 24-bit data (left channel blue, right red).
Fig.24 CH Precision I1, digital input, HF intermodulation spectrum, DC–30kHz, 19+20kHz at 0dBFS, 44.1kHz data (left channel blue, right red; linear frequency scale).
Fig.25 CH Precision I1, digital input, high-resolution jitter spectrum of analog output signal, 11.025kHz at –6dBFS, sampled at 44.1kHz with LSB toggled at 229Hz: 16-bit AES3 data (left channel blue, right red). Center frequency of trace, 11.025kHz; frequency range, ±3.5kHz.
Fig.26 CH Precision I1, digital input, high-resolution jitter spectrum of analog output signal, 11.025kHz at –6dBFS, sampled at 44.1kHz with LSB toggled at 229Hz: 24-bit AES3 data (left channel blue, right red). Center frequency of trace, 11.025kHz; frequency range, ±3.5kHz.
CH Precision's I1 Universal integrated amplifier offers excellent measured performance, and its variable negative-feedback control allows the addition of distortion to suit its owner's taste!—John Atkinson