Sidebar 3: Measurements
I used DRA Labs' MLSSA system, a calibrated DPA 4006 microphone, and an Earthworks microphone preamplifier to measure the quasi-anechoic frequency- and time-domain behavior of the 805 D4 Signature in the farfield. I used an Earthworks QTC-40 microphone for the nearfield responses and Dayton Audio's DATS V2 system to measure the impedance magnitude and phase. I used a plastic-tape accelerometer with a preamplifier of my own design to examine the enclosure's vibrational behavior.
Footnote 1: EPDR is the resistive load that gives rise to the same peak dissipation in an amplifier's output devices as the loudspeaker. See "Audio Power Amplifiers for Loudspeaker Loads," JAES, Vol.42 No.9, September 1994, and stereophile.com/reference/707heavy/index.html.
Footnote 2: A nearfield measurement assumes that the baffle extends to infinity in both horizontal and vertical planes, which means that the loudspeaker is firing into hemispherical space rather than a full sphere. See this discussion.
Footnote 3: I average 20 1/6-octave–smoothed spectra, taken for the left and right speakers individually using a 96kHz sample rate, in a vertical rectangular grid 36" wide by 18" high and centered on the positions of my ears. This tends to smooth out the peaks and dips below 400Hz that are due to the room's resonant modes.
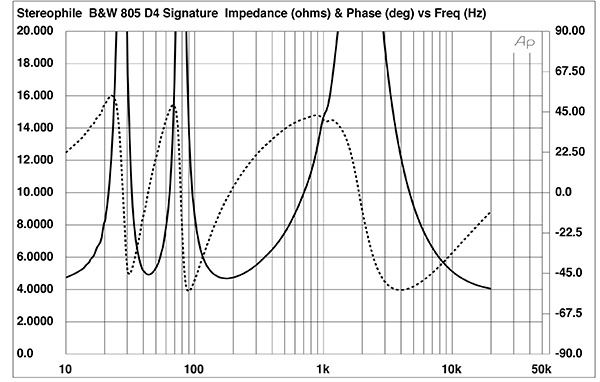
Fig.1 B&W 805 D4 Signature, electrical impedance (solid) and phase (dashed) (2 ohms/vertical div.).
Bowers & Wilkins specifies the 805 D4 Signature's voltage sensitivity as 88dB/2.83V/m. My B-weighted estimate, measured on the tweeter axis, was within experimental error of that figure, at 88.4dB(B)/2.83V/m. The 805 D4 Signature's nominal impedance is specified as 8 ohms, with a minimum value of 4.6 ohms. The impedance magnitude (fig.1, solid trace) varied considerably but had an average value close to 8 ohms. The minimum impedances I measured were 4.68 ohms at 175Hz and 4 ohms at 20kHz. The electrical phase angle (fig.1, dotted trace) is occasionally high, with the result that the effective resistance, or EPDR (footnote 1), drops below 3 ohms in several places between 33Hz and 574Hz and above 4.5kHz. The minimum EPDR values were 2.54 ohms at 56Hz, 2.34 ohms at 108Hz, 2.71 ohms at 373Hz, and 2 ohms between 8.9kHz and 10kHz. The 805 D4 Signature is a relatively current-hungry load for the partnering amplifier. This is probably why the sound hardened somewhat with the NAD M10 amplifier when I turned up the volume.
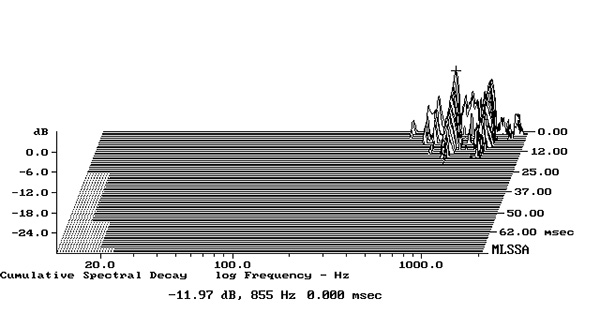
Fig.2 B&W 805 D4 Signature, cumulative spectral-decay plot calculated from output of accelerometer fastened to the center of a sidewall (MLS driving voltage to speaker, 7.55V; measurement bandwidth, 2kHz).
The enclosure's sidewalls seemed inert when I rapped them with my knuckles. While I found resonant modes at 855Hz and 1100Hz on the aluminum back wall and the center of each sidewall (fig.2), these modes are very low in level and have a high Q (Quality Factor). It is extremely unlikely they will have audible consequences.
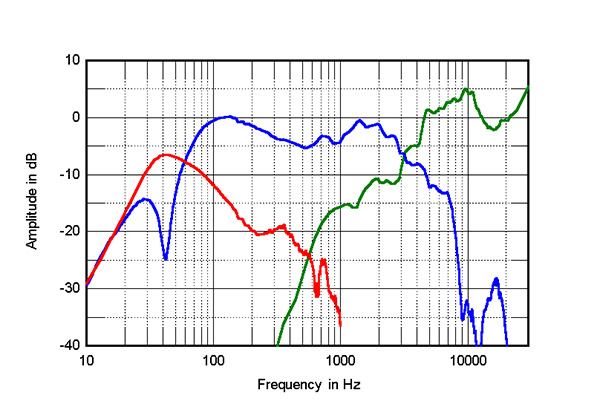
Fig.3 B&W 805 D4 Signature, acoustic crossover on tweeter axis at 50", corrected for microphone response, with the nearfield responses of the woofer (blue) and port (red), respectively plotted below 350Hz and 1kHz.
The saddle centered on 42Hz in the impedance magnitude trace suggests that this is the tuning frequency of the port mounted below the woofer on the front baffle. The blue trace below 300Hz in fig.3 shows the woofer's response measured in the nearfield; it has the expected notch at the reflex tuning frequency. The port's nearfield response (fig.3, red trace) peaks at the tuning frequency before rolling off cleanly at higher frequencies. The woofer's farfield output (blue trace) crosses over to the tweeter (green trace) at 3kHz. The crossover appears to be first-order, with both drive units rolling off relatively slowly outside their passbands. The tweeter is balanced up to 5dB too high in level, though its output in the top audio octave is suppressed before rising again at the 30kHz limit of this graph. (When Paul Miller measured the 805 D4 Signature for Stereophile's sister magazine Hi-Fi News, he found that the tweeter's output peaked at 48kHz.)
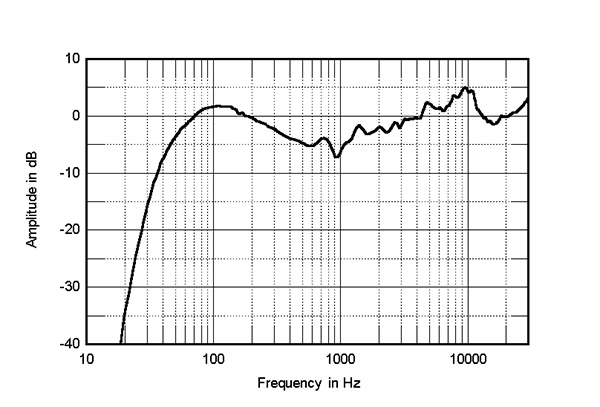
Fig.4 B&W 805 D4 Signature, anechoic response on tweeter axis at 50", averaged across 30° horizontal window and corrected for microphone response, with the complex sum of the nearfield woofer and port responses plotted below 300Hz.
The complex sum of the nearfield responses of the B&W's woofer and port is shown as the black trace below 300Hz in fig.4; the peak in the upper bass is due to the nearfield measurement technique (footnote 2), though the midrange appears to be suppressed. (This lack of midrange energy can also be seen in the Hi-Fi News Lab Report.) The black trace above 300Hz in fig.4 shows the 805 D4 Signature's farfield response, averaged across a 30° horizontal window centered on the tweeter axis. It smoothly rises with increasing frequency in the treble, peaking between 9kHz and 10kHz. This is too high in frequency to make the B&W sound "bright," but as I found, it will add "air" to the perceived balance. Fig.4 was taken with the right-hand speaker of the pair; the output of the left-hand speaker's tweeter was 1dB higher in level, though the two speakers were otherwise well matched.
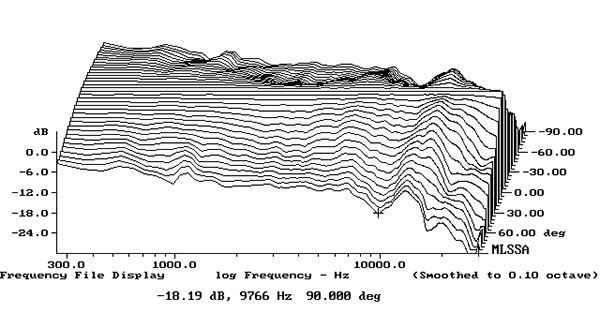
Fig.5 B&W 805 D4 Signature, lateral response family at 50", normalized to response on tweeter axis, from back to front: differences in response 90–5° off axis, reference response, differences in response 5–90° off axis.
Fig.6 B&W 805 D4 Signature, vertical response family at 50", normalized to response on tweeter axis, from back to front: differences in response 45–5° above axis, reference response, differences in response 5–45° below axis.
The speaker's horizontal radiation pattern, normalized to the response on the tweeter axis, which therefore appears as a straight line, is shown in fig.5. The dispersion is very well controlled, with the contour lines in this graph evenly spaced throughout the midrange and mid-treble region, implying accurate, stable stereo imaging. The radiation pattern narrows in the region of the on-axis peak in the high treble, suggesting that experimenting with toe-in will be advantageous. Fig.6 shows the 805 D4 Signature's dispersion in the vertical plane, again normalized to the response on the tweeter axis. A suckout develops in the crossover region 5° above the tweeter axis, with the mid-treble region becoming suppressed 5° and more below that axis.
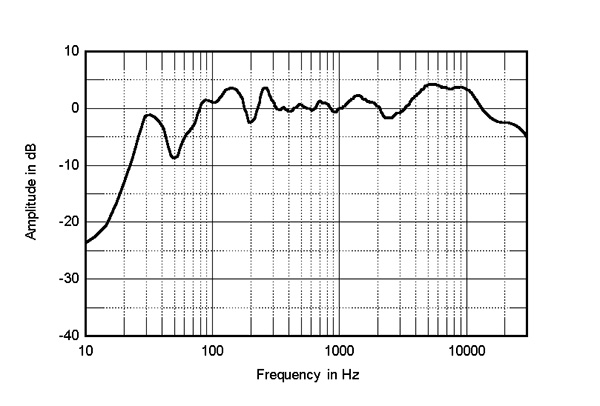
Fig.7 B&W 805 D4 Signature, spatially averaged, 1/6-octave response in JA's listening room.
Fig.7 shows the spatially averaged response of the 805 D4 Signatures in my room (footnote 3). The low-frequency register is slightly shelved down—as I wrote in the main review text, it wasn't possible to reinforce the bass by moving the speakers closer to the wall behind them—but the in-room response is respectably even in the midrange. As expected from fig.4, there is an excess of energy between 3kHz and 12kHz.
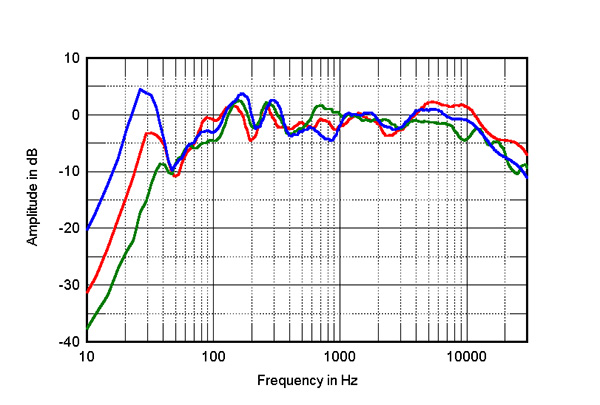
Fig.8 B&W 805 D4 Signature, spatially averaged, 1/6-octave response in JA's listening room (red), of the B&W 804 D4 (blue), and the GoldenEar BRX (green).
The red trace in fig.8 repeats the spatially averaged response of the 805 D4 Signature; the blue trace is that of the B&W Diamond Series 804 D4 tower that I reviewed in January 2022; the green trace is that of the GoldenEar BRX that I reviewed in September 2020. The three speakers behave similarly from the lower midrange through the low treble. The in-room responses of the three speakers differ most at high frequencies. The BRX's treble slopes gently down in a linear manner, primarily due to the increased absorption of the room's furnishings as the frequency increases. The 804 D4's high frequencies are 3dB higher in level than the GoldenEar's, while the 805 D4 Signature's are another 3dB higher in level.
While the 804 D4 maximally excites the lowest-frequency resonant mode in my room, the BRXs' bass is lower in level than that of the two B&W speakers; as I have mentioned in other reviews, I use Roon's DSP parametric equalizer to flatten and extend this speaker's low frequencies in-room.
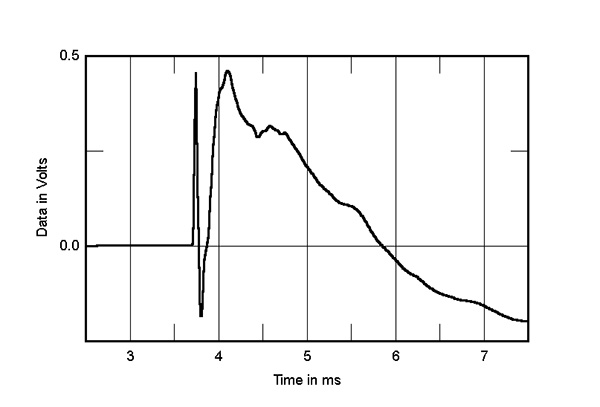
Fig.9 B&W 805 D4 Signature, step response on tweeter axis at 50" (5ms time window, 30kHz bandwidth).
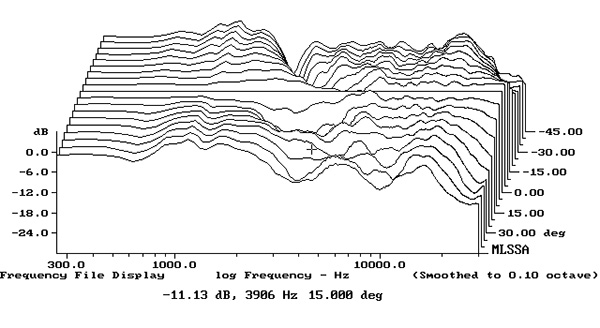
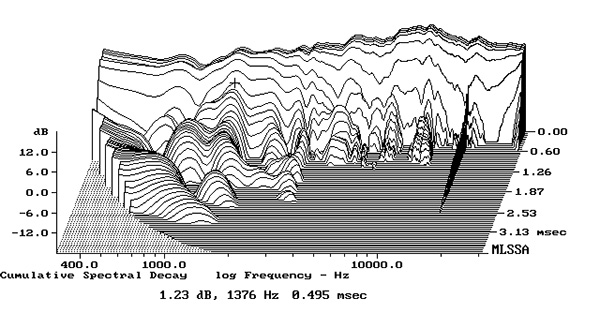
Fig.10 B&W 805 D4 Signature, cumulative spectral-decay plot on tweeter axis at 50" (0.15ms risetime).
Turning to the time domain, the B&W's step response on the tweeter axis (fig.9) indicates that both drive units are connected in positive acoustic polarity. The tweeter's output arrives first at the microphone, followed by that of the woofer. The decay of the tweeter's step smoothly blends with the start of the woofer's output, but there is a strong reflection around 400µs after the woofer's step, which may be due to a termination issue between the woofer's Continuum cone and the surround. This correlates with a ridge of delayed energy centered on 1376Hz in the 805 D4 Signature's cumulative spectral-decay ("waterfall") plot (fig.10). Otherwise, the B&W's waterfall plot is superbly clean. (Ignore the ridge of delayed energy close to 16kHz, which is due to interference from the measurement computer's video circuitry.)
The Bowers & Wilkins 805 D4 Signature offers superb measured performance in some areas—the textbook woofer alignment, the extremely quiet enclosure, that impressively clean cumulative spectral-decay plot, the well-controlled lateral dispersion—but its high-frequency response is, for want of a better word, "tailored." I had no problem getting the 805 D4 Signature to sing in my room, but it will need extra care in setup and system matching.—John Atkinson
Footnote 1: EPDR is the resistive load that gives rise to the same peak dissipation in an amplifier's output devices as the loudspeaker. See "Audio Power Amplifiers for Loudspeaker Loads," JAES, Vol.42 No.9, September 1994, and stereophile.com/reference/707heavy/index.html.