| Columns Retired Columns & Blogs |
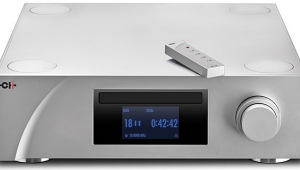
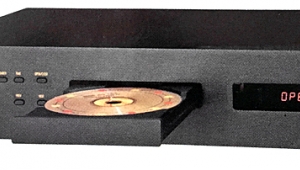
Boulder 1021 disc player Measurements
Sidebar 3: Measurements
I examined the measured behavior of the Boulder 1021 using the Audio Precision SYS2722 system (see www.ap.com and "As We See It" in the January 2008 issue), as well as, for some tests, our Audio Precision System One and the Miller Audio Research Jitter Analyzer. I used my regular CD-R of 16-bit test tones, as well as a data CD-R on which I had burned 24-bit/96kHz- or 192kHz-sampled WAV files of a subset of those test tones.
The Boulder's maximum output was to specification, at 4.06V RMS; this was the same with the output set to Fixed volume, or to Variable with the volume control set to "0." Using a balanced–unbalanced adapter will reduce this level to 2V, of course, the CD standard's recommendation. The volume control itself operated in accurate 1dB steps, with the lowest setting, "–80," corresponding to –79.93dB, and even this minimal error being due only to the imminent approach of the low noise floor. The output preserved absolute polarity, the XLRs being wired with pin 2 hot, and the output impedance was very low at 100 ohms.
The 1021 featured the best error correction I have encountered. Playing the Pierre Verany test CD, which has laser-cut gaps in its data spiral, there were no mutes or glitches in the player's output until the gap was 2.5mm in length, and even then the Boulder recovered and kept playing a continuous tone, with no uncorrectable errors being flagged in its digital-output subcode. The gap reached its maximum length before the Boulder muted its output! This is extraordinarily good performance.
The Boulder 1021's channel separation (not shown) was superb, at better than 110dB in both directions below 10kHz. Its frequency response is shown in fig.1. The bottom pair of traces was taken with preemphasized CD data; there is a very slight boost in the mid-treble, but given how few CDs are preemphasized, this will have no significant consequences. Below 22kHz, the top pair of traces show the response with regular CD data; the top audio octave starts a gentle rolloff, reaching –0.4dB at 20kHz. The middle plot shows the response with 96kHz-sampled data starting at 1kHz; it overlays the CD response almost exactly up to 22kHz, beyond which it continues the smooth rolloff to reach –2dB at 40kHz. Above 43kHz, the output drops like a stone, as expected. With 192kHz data (top traces), the rolloff continues above 43kHz to reach –5dB at 60kHz and –16dB at 92kHz, with the expected steep rolloff above that frequency.
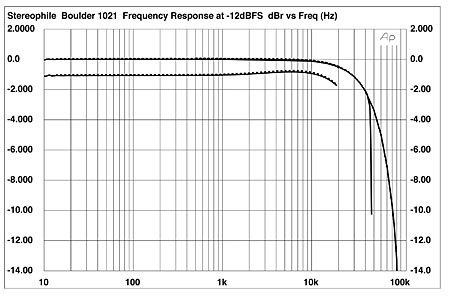
Fig.1 Boulder 1021, frequency response at –12dBFS into 100k ohms with preemphasized CD data (bottom traces), with data at 96kHz (middle) and 192kHz (top, right channel dashed; 2dB/vertical div.).
For consistency with earlier reviews, my first test of a player's resolution is to play a dithered tone at –90dBFS while sweeping a 1/3-octave bandpass filter from 20kHz to 20Hz. The result with CD data is shown as the top pair of traces in fig.2. The trace peaks at exactly –90dBFS, suggesting that the Boulder has very low linearity error, and the traces really show only the effect of the recorded dither noise. The middle pair of traces show the same analysis, but now with the 1021 playing a 24-bit file from a CD-R. The noise floor has dropped by 20dB, suggesting that the Boulder has an ultimate resolution approaching 20 bits, which is superb. The bottom two traces were taken with a 24-bit tone at –120dBFS. The tone is well resolved, and no harmonic components are evident. However, both of the 24-bit analyses unmask power-supply–related spuriae at 60, 180, and 300Hz. Yes, these are extremely low in level and will have no subjective consequences, but their presence does indicate that there is some magnetic leakage from the supply transformers into the audio circuitry.

Fig.2 Boulder 1021, 1/3-octave spectrum with noise and spuriae of dithered 1kHz tone at –90dBFS with 16-bit CD data (top), 24-bit data (middle at 2kHz), and of dithered 1kHz tone at –120dBFS with 24-bit data (bottom at 1kHz). (Right channel dashed.)
Figs. 3 and 4 show FFT-derived plots for the 16- and 24-bit tones at –90dBFS, respectively. Again the huge drop in the noise floor with the increase in bit depth is apparent, as is the absence of any harmonic-distortion spuriae.
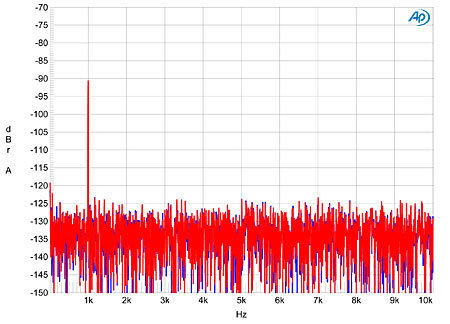
Fig.3 Boulder 1021, FFT-derived spectrum with noise and spuriae of dithered 1kHz tone at –90dBFS with 16-bit CD data (left channel blue, right red).

Fig.4 Boulder 1021, FFT-derived spectrum with noise and spuriae of dithered 1kHz tone at –90dBFS with 24-bit data (left channel blue, right red).
With its extremely low noise and excellent-performing DACs, the Boulder 1021's behavior on my usual 16-bit linearity test was dominated by the recorded dither (fig.5). And when you compare the waveforms of undithered tones at exactly –90.31dBFS with 16-bit (fig.6) and 24-bit data (fig.7), the 16-bit representation is shown to be basically perfect: the waveform is symmetrical, the three DC voltage levels are very well defined, and the Gibbs Phenomenon "ringing" due to the bandwidth limiting is well reproduced. The 24-bit representation is an excellent sinewave, despite the very low signal level. About the only things you can see in these two graphs that are not superb are differing degrees of microscopic DC offset in the two channels.
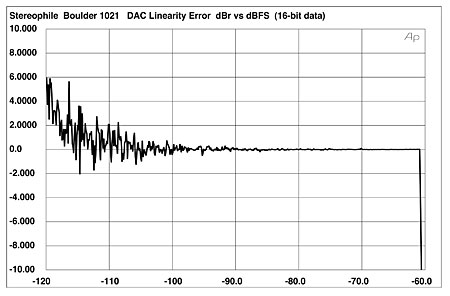
Fig.5 Boulder 1021, linearity error (16-bit data).
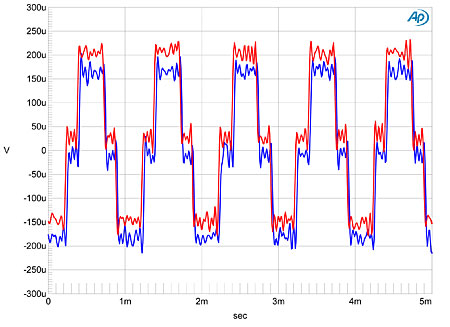
Fig.6 Boulder 1021, waveform of undithered 1kHz sinewave at –90.31dBFS, CD data (left channel blue, right red).
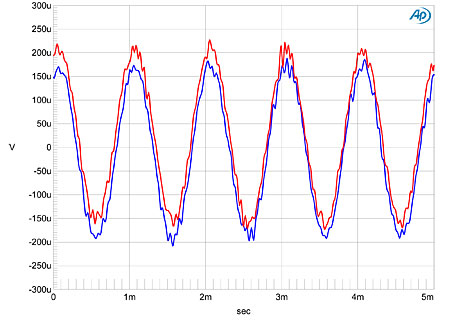
Fig.7 Boulder 1021, waveform of undithered 1kHz sinewave at –90.31dBFS, 24-bit data (left channel blue, right red).
The Boulder's output stage is also of the highest quality. Fig.8 is an FFT-derived spectrum of the 1021's output while it drives a full-scale 1kHz sinewave into 600 ohms. Despite the punishing current demands of this load, all the distortion harmonics lie at or below –114dB (0.0002%), with the third the highest in level, and the left channel (blue trace) slightly better than the right (red). And no harmonics higher than the fifth are visible above the extremely low noise floor. Wow! The Boulder's performance on the high-frequency intermodulation test was also impressive (fig.9). All the high-order intermodulation products lie at or below –100dB (0.001%), and the second-order difference component at 1kHz lies at just –114dB.
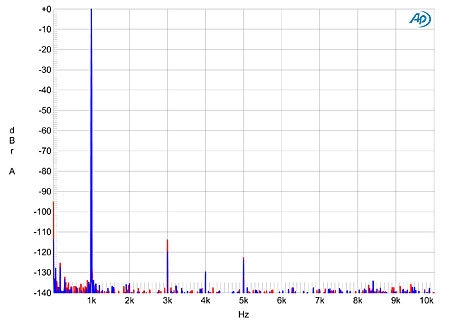
Fig.8 Boulder 1021, spectrum of 1kHz sinewave at 0dBFS into 600 ohms, 24-bit data (left channel blue, right red; linear frequency scale).
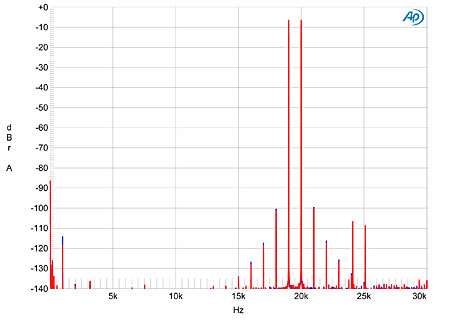
Fig.9 Boulder 1021, HF intermodulation spectrum, 19+20kHz at 0dBFS peak into 600 ohms, 24-bit data (left channel blue, right red; linear frequency scale).
Finally tested with the 16-bit J-Test signal, the Boulder 1021 produced a spectrum that basically shows just the high-order harmonics of the test signal's low-frequency component (fig.10). The noise floor is again superbly low, and while there is a slight degree of spectral spreading at the base of the spike that represents the 11.025kHz tone, this is negligible in real terms.
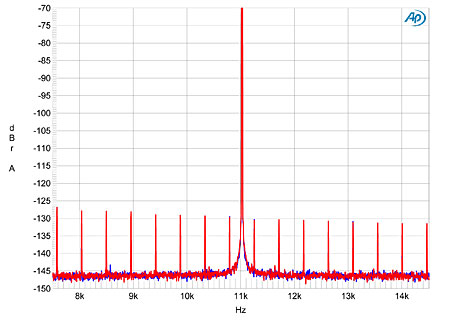
Fig.10 Boulder 1021, high-resolution jitter spectrum of analog output signal, 11.025kHz at –6dBFS, sampled at 44.1kHz with LSB toggled at 229Hz, CD data. Center frequency of trace, 11.025kHz; frequency range, ±3.5kHz (left channel blue, right red).
Even without taking its sound quality into consideration, the measured performance of the Boulder 1021 is extremely impressive: textbook in pretty much every way.—John Atkinson
- Log in or register to post comments
