Sidebar 3: Measurements
I measured the Bel Canto e1X DAC with my Audio Precision SYS2722 system. Looking first at the digital inputs, the AES3 and coaxial S/PDIF inputs accepted data sampled at all rates up to 192kHz; TosLink was restricted to 96kHz data. Apple's AudioMIDI utility revealed that the e1X accepted 24-bit integer data via USB sampled at all rates from 44.1kHz to 192kHz. (The print manual says 384kHz.) Apple's USB Prober app identified the Bel Canto as "Bel Canto Hi-Res 2" from "Bel Canto" and the USB port operated in the optimal isochronous asynchronous mode.
The Bel Canto's analog outputs preserved absolute polarity (ie, were non-inverting) from all the digital inputs. The maximum output from the e1X's balanced analog outputs, with full-scale 1kHz data and the volume control set to its maximum of "100," was 5.29V. It was 2.64V from the main, single-ended outputs and 4.2V from the headphone output. The volume control appeared to operate in 0.5dB steps, ie, setting it to "85" reduced the level by 7.5dB (15 × 0.5dB). The balanced output impedance, specified as 100 ohms, was 99 ohms from 20Hz to 20kHz. The main single-ended output impedance was 148 ohms, the headphone output impedance was 11.5 ohms, both values consistent at all audio frequencies.
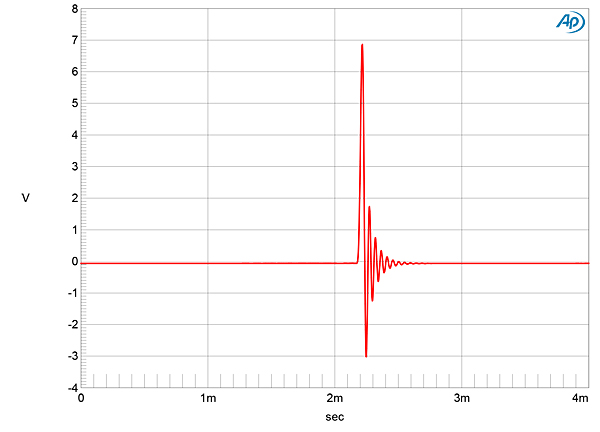
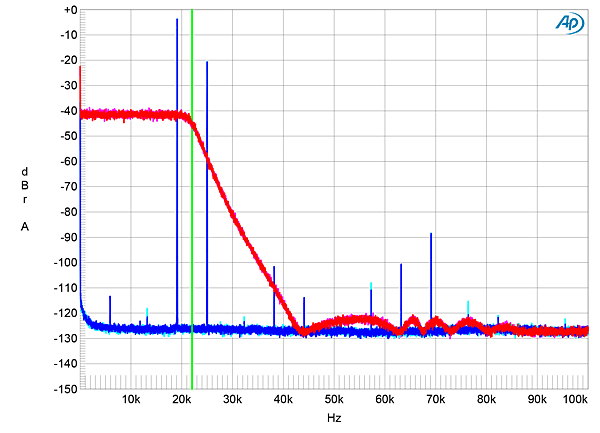
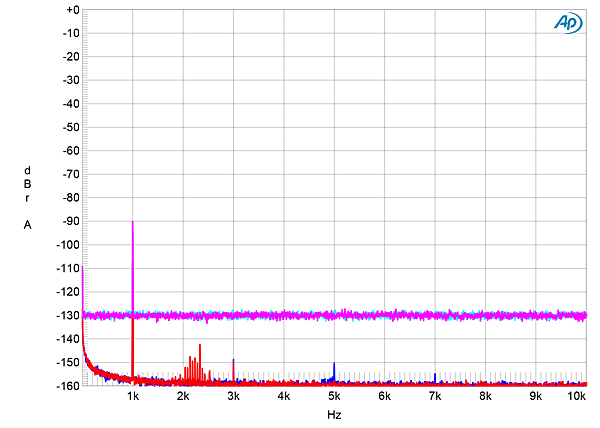
Fig.1 shows the e1X's impulse response with 44.1kHz data. It is typical of a short minimum-phase reconstruction filter, with a small amount of ringing following the single full-scale sample. With 44.1kHz white-noise data, the filter rolled off slowly above the audioband (fig.2, magenta and red traces), not reaching full stop-band attenuation until 44kHz. The shape of the ultrasonic rolloff was very familiar; it is typical of the filter used by MQA-capable devices for non-MQA data (footnote 1). With a 19.1kHz tone at –3dBFS (cyan, blue), the slow rolloff means that the aliased image at 25kHz is only suppressed by 17dB. The harmonics associated with the 19.1kHz tone are all very low in level, however, with the second harmonic lying at –101dB (0.001%) and the third 10dB lower than that.
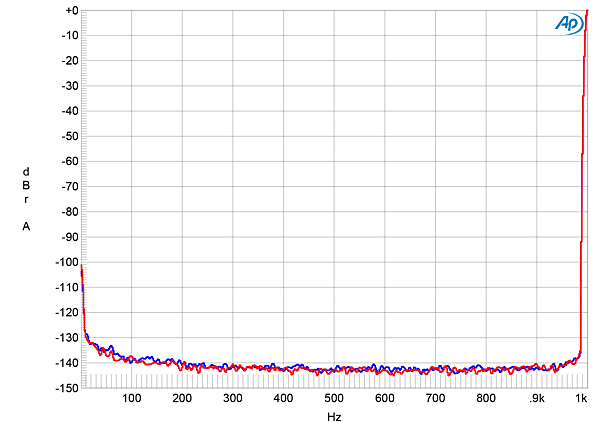
 Channel separation (not shown) was superb, at >25dB in both directions below 1kHz, decreasing to a still excellent 113dB at the top of the audioband. The low-frequency noisefloor (fig.6) was free from any power supply–related spuriae, with a very low level of random noise.

 Turning to the Bel Canto's phono input, I connected a wire from the Audio Precision's ground terminal to the grounding lug on the e1X's rear panel, to obtain the lowest noise. The phono input preserved absolute polarity. There are four gain settings, labeled "5.0mV," "2.5mV," "0.5mV," and "0.25mV." I measured maximum gains at 1kHz at the balanced outputs, with the volume control set to "85," of 42.0dB, 47.8dB, 62.3dB, and 68.3dB, respectively. The first two are appropriate for moving magnet cartridges, the last two for moving coil cartridges. The input impedance can be set to nominal values of 50 ohms, 100 ohms, 500 ohms, 1000 ohms, or 47k ohms. The measured input impedances were close to the nominal values, at 63 ohms, 113 ohms, 507 ohms, 988 ohms, and 45k ohms. The last value was at 20Hz and 1kHz; it dropped to 38k ohms at 20kHz.
The phono input's RIAA error was superbly low (fig.19), though the low frequencies rolled off a little, reaching –2.5dB at 10Hz. (The Tilt and Bass EQ controls were bypassed for this measurement.) Like the line input's response, the ultrasonic output rolled off sharply above 30kHz, due to the action of the A/D converter's antialiasing filter. The S/N ratio depended on the gain that had been selected. With the lowest, MM-compatible gain and the volume control set to "85," the wideband, unweighted ratio with the inputs shorted to ground was a good 66.3dB (average of both channels), ref. 1kHz at 5mV. Restricting the measurement bandwidth increased the ratio to 80.2dB (left) and 88.dB (right), while an A-weighting filter further increased the ratio to 92dB in both channels. Setting the gain to the MC-compatible "0.5mV" reduced the wideband, unweighted ratios to 57.0dB (left) and 62.4dB (right), ref. 1kHz at 0.5mV, the audioband ratios to 59.dB (left) and 69dB (right), and the A-weighted ratios to 71.8dB (left) and 74.9dB (right). This is a respectably quiet phono stage.
Turning to the Bel Canto's phono input, I connected a wire from the Audio Precision's ground terminal to the grounding lug on the e1X's rear panel, to obtain the lowest noise. The phono input preserved absolute polarity. There are four gain settings, labeled "5.0mV," "2.5mV," "0.5mV," and "0.25mV." I measured maximum gains at 1kHz at the balanced outputs, with the volume control set to "85," of 42.0dB, 47.8dB, 62.3dB, and 68.3dB, respectively. The first two are appropriate for moving magnet cartridges, the last two for moving coil cartridges. The input impedance can be set to nominal values of 50 ohms, 100 ohms, 500 ohms, 1000 ohms, or 47k ohms. The measured input impedances were close to the nominal values, at 63 ohms, 113 ohms, 507 ohms, 988 ohms, and 45k ohms. The last value was at 20Hz and 1kHz; it dropped to 38k ohms at 20kHz.
The phono input's RIAA error was superbly low (fig.19), though the low frequencies rolled off a little, reaching –2.5dB at 10Hz. (The Tilt and Bass EQ controls were bypassed for this measurement.) Like the line input's response, the ultrasonic output rolled off sharply above 30kHz, due to the action of the A/D converter's antialiasing filter. The S/N ratio depended on the gain that had been selected. With the lowest, MM-compatible gain and the volume control set to "85," the wideband, unweighted ratio with the inputs shorted to ground was a good 66.3dB (average of both channels), ref. 1kHz at 5mV. Restricting the measurement bandwidth increased the ratio to 80.2dB (left) and 88.dB (right), while an A-weighting filter further increased the ratio to 92dB in both channels. Setting the gain to the MC-compatible "0.5mV" reduced the wideband, unweighted ratios to 57.0dB (left) and 62.4dB (right), ref. 1kHz at 0.5mV, the audioband ratios to 59.dB (left) and 69dB (right), and the A-weighted ratios to 71.8dB (left) and 74.9dB (right). This is a respectably quiet phono stage.
Footnote 1: See, for example, fig.9 here.
Fig.1 Bel Canto e1X DAC, impulse response (one sample at 0dBFS, 44.1kHz sampling, 4ms time window).
Fig.2 Bel Canto e1X DAC, wideband spectrum of white noise at –4dBFS (left channel red, right magenta) and 19.1kHz tone at –3dBFS (left blue, right cyan) into 100k ohms with data sampled at 44.1kHz (20dB/vertical div.).
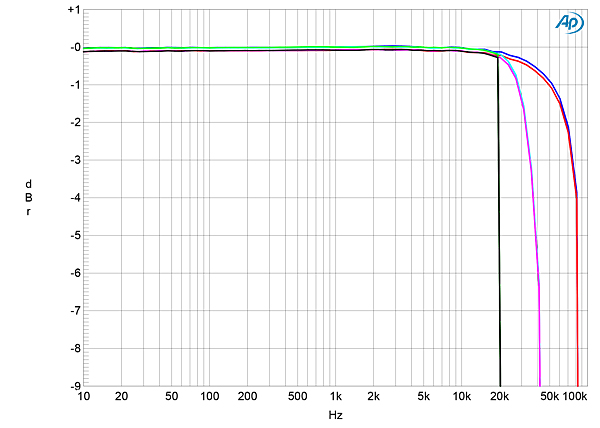
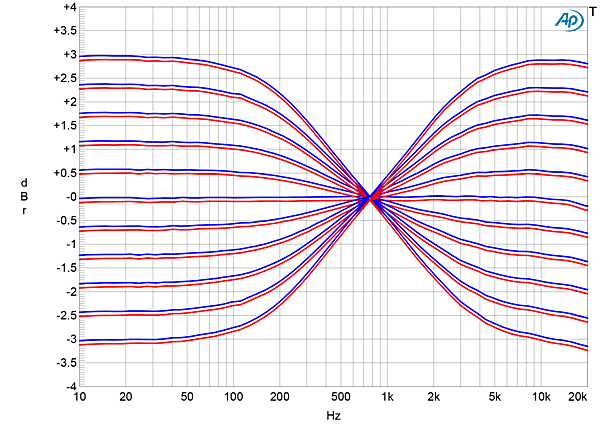
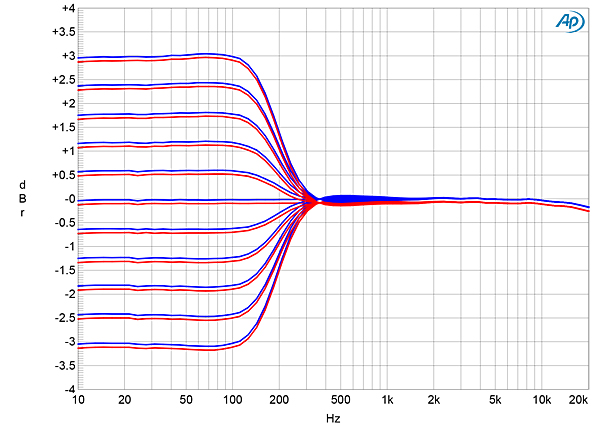
The Bel Canto's frequency response with data sampled at 44.1, 96, and 192kHz is shown in fig.3. The responses are all flat to 20kHz, with then a slow rolloff at the two higher sample rates. Fig.4 shows the audioband response with the Tilt control at all settings from "–5" to "5." The response hinges around 750Hz, with a maximum boost or cut at 100Hz and 10kHz of close to 3dB. The effect of the Bass EQ control, again at all settings between "–5" and "5," is shown in fig.5. The hinge frequency is 350Hz, and each step increases or decreases the level at and below 100Hz by 0.6dB, as specified.
Fig.3 Bel Canto e1X DAC, frequency response at –12dBFS into 100k ohms with data sampled at: 44.1kHz (left channel green, right gray), 96kHz (left cyan, right magenta), and 192kHz (left blue, right red) (1dB/vertical div.).
Fig.4 Bel Canto e1X DAC, frequency response at –12dBFS into 100k ohms with Tilt control at all settings between "–5+ and "5" (1dB/vertical div.).
Fig.5 Bel Canto e1X DAC, frequency response at –12dBFS into 100k ohms with Bass EQ control at all settings between "–5+ and "5" (1dB/vertical div.).
Fig.6 Bel Canto e1X DAC, balanced output, spectrum with noise and spuriae of dithered 1kHz tone at 0dBFS with 24-bit TosLink data (left blue, right red) (20dB/vertical div.).
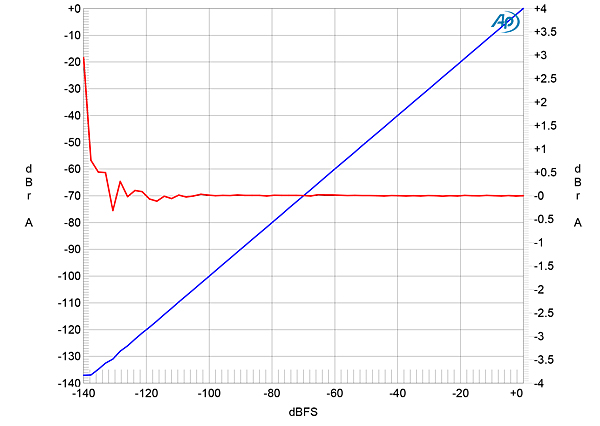
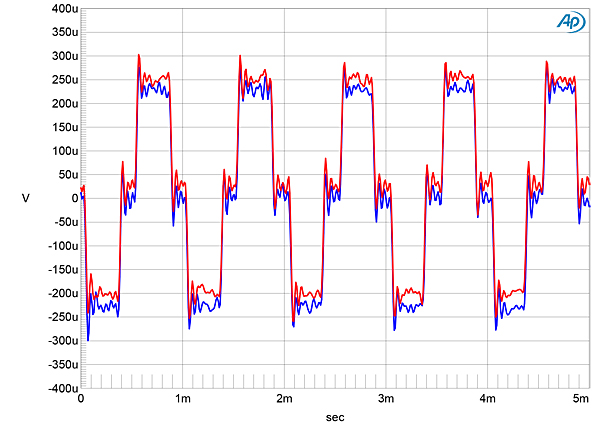
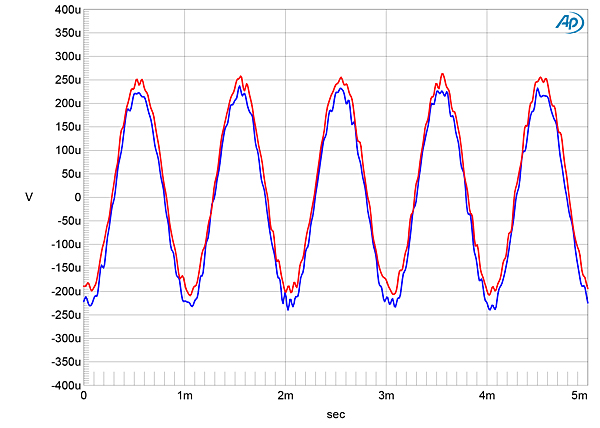
The red trace in fig.7 plots the error in the analog output level as a 24-bit, 1kHz digital tone steps down from 0dBFS to –140dBFS. (The volume control was set to "100" for this and the next three measurements.) The amplitude error is negligible until the signal lies below –135dBFS, which implies very high resolution. An increase in bit depth from 16 to 24 with dithered data representing a 1kHz tone at –90dBFS (fig.8) dropped the e1X's noisefloor by 30dB, which implies a DAC resolution of close to 21 bits, one of the highest I have encountered. When I played undithered data representing a tone at exactly –90.31dBFS, the waveform was symmetrical, with the three DC voltage levels described by the data cleanly resolved (fig.9). Repeating the measurement with undithered 24-bit data gave a well-formed, noise-free sinewave (fig.10).
Fig.7 Bel Canto e1X DAC, left channel, 1kHz output level vs 24-bit data level in dBFS (blue, 20dB/vertical div.); linearity error (red, 1dB/small vertical div.).
Fig.8 Bel Canto e1X DAC, spectrum with noise and spuriae of dithered 1kHz tone at –90dBFS with: 16-bit TosLink data (left channel cyan, right magenta), 24-bit TosLink data (left blue, right red) (20dB/vertical div.).
Fig.9 Bel Canto e1X DAC, waveform of undithered 1kHz sinewave at –90.31dBFS, 16-bit data (left channel blue, right red).
Fig.10 Bel Canto e1X DAC, waveform of undithered 1kHz sinewave at –90.31dBFS, 24-bit data (left channel blue, right red).
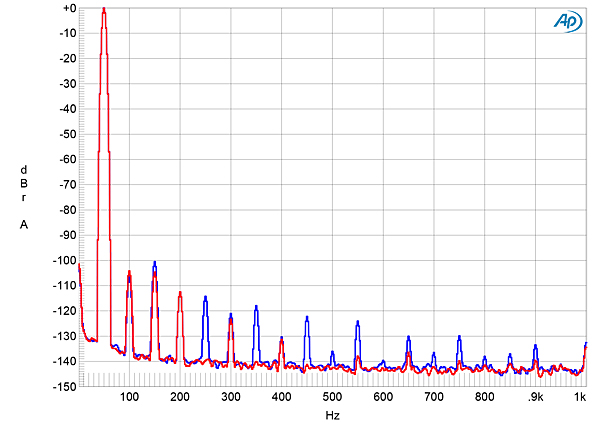
As shown in fig.2, the e1X produced very low levels of harmonic distortion. With a full-scale 50Hz tone, the third harmonic was the highest in level in the balanced outputs, at just –100dB (0.001%, fig.11), and the second, fourth, and sixth harmonics were at even lower levels in both channels. Some odd-order harmonics were present in the left channel (blue trace), but these are still very low in level. This spectrum was taken into the high 100k ohms load. When I reduced the load impedance to the punishing 600 ohms, the levels of the harmonics hardly rose. Intermodulation distortion with an equal mix of 19 and 20kHz tones, the combination peaking at –3dBFS, was vanishingly low in level (fig.12), though the aliased images of the primary tones are present. Again, the distortion didn't rise into 600 ohms, but increasing the signal level so that it peaked at 0dBFS introduced a large number of high-level aliased tones.
Fig.11 Bel Canto e1X DAC, balanced output, 24-bit TosLink data, spectrum of 50Hz sinewave, DC–1kHz, at 0dBFS into 100k ohms (left channel blue, right red; linear frequency scale).
Fig.12 Bel Canto e1X DAC, balanced output, 24-bit TosLink data, HF intermodulation spectrum, DC–30kHz, 19+20kHz at –3dBFS into 100k ohms, 44.1kHz data (left channel blue, right red; linear frequency scale).
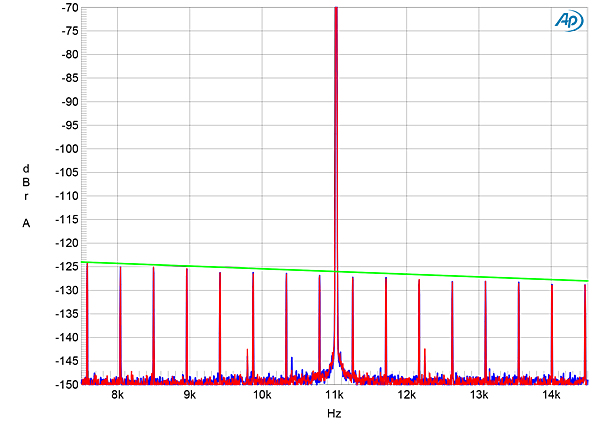
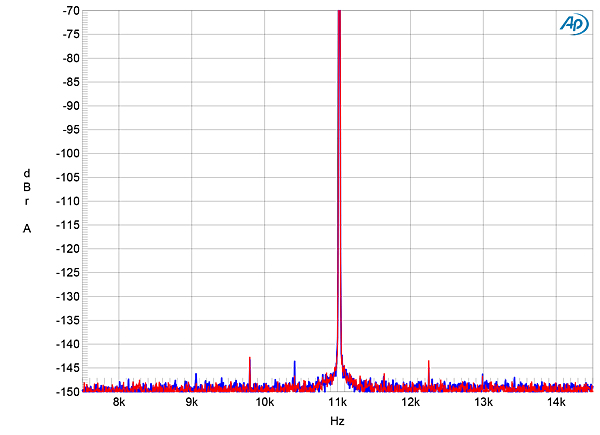
Fig.13 shows the spectrum of the e1X's output when it was fed high-level, optical, undithered, 16-bit J-Test data. The odd-order harmonics of the undithered low-frequency, LSB-level squarewave all lie at the correct levels, indicated by the sloping green line. The noisefloor between the sidebands is at a commendably low level, as it was with 24-bit J-Test data (fig.14). Jitter via the USB port was similarly very low. It might use the venerable PCM1792A DAC chip, but Bel Canto's e1X did very well on the test bench, offering very high resolution and superbly low linearity error coupled with very low distortion and noise for digital input signals.
Fig.13 Bel Canto e1X DAC, high-resolution jitter spectrum of analog output signal, 11.025kHz at –6dBFS, sampled at 44.1kHz with LSB toggled at 229Hz: 16-bit TosLink data (left channel blue, right red). Center frequency of trace, 11.025kHz; frequency range, ±3.5kHz.
Fig.14 Bel Canto e1X DAC, high-resolution jitter spectrum of analog output signal, 11.025kHz at –6dBFS, sampled at 44.1kHz with LSB toggled at 229Hz: 24-bit TosLink data (left channel blue, right red). Center frequency of trace, 11.025kHz; frequency range, ±3.5kHz.
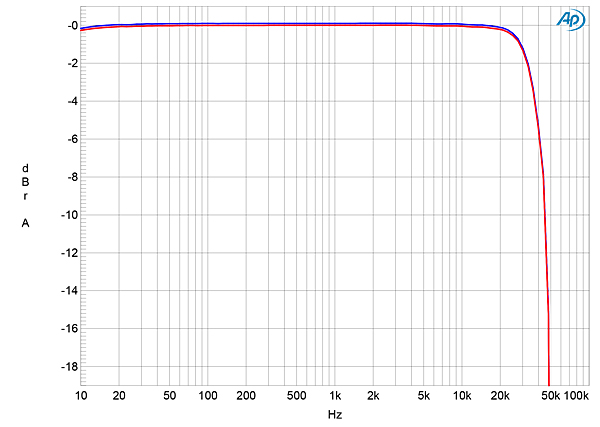
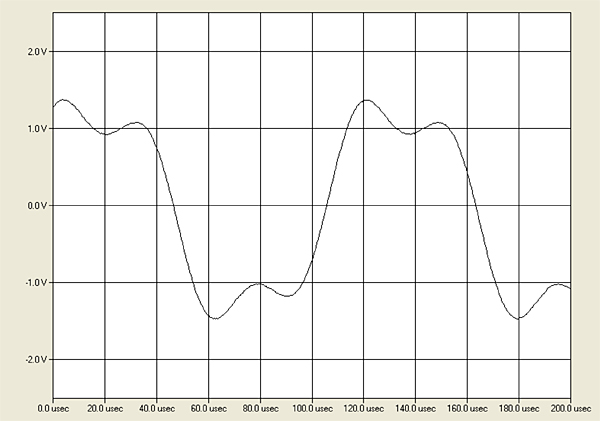
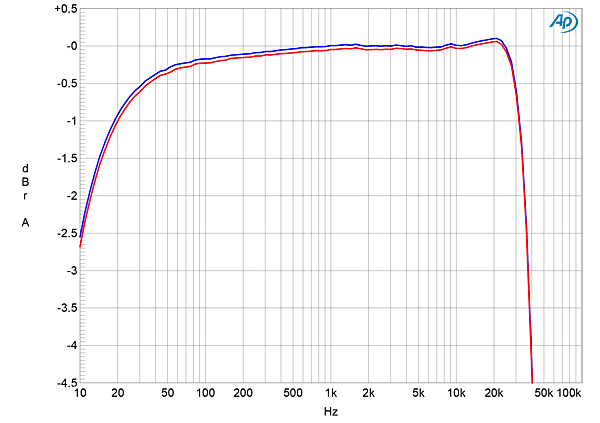
The single-ended line analog inputs' input impedance is specified as 10k ohms. I measured 14k ohms at 20Hz and 1kHz, 12.5k ohms at 20kHz. The maximum gain at the balanced outputs was 8.14dB; it was 2.17dB at the unbalanced outputs, and 6.17dB at the headphone output. All three analog outputs preserved absolute polarity with analog input signals. The analog input's frequency response (fig.15) was flat in the audioband, then rolled off sharply above 30kHz, with the output down by 3dB at 37kHz. The line input's reproduction of a 10kHz squarewave (fig.16) featured four cycles of ringing for each cycle, which is presumably due to the analog input being digitized with a sample rate of 96kHz.
Fig.15 Bel Canto e1X DAC, line analog input, frequency response (left channel blue, right red) (1dB/vertical div.).
Fig.16 Bel Canto e1X DAC, line analog input, 10kHz squarewave into 100k ohms.
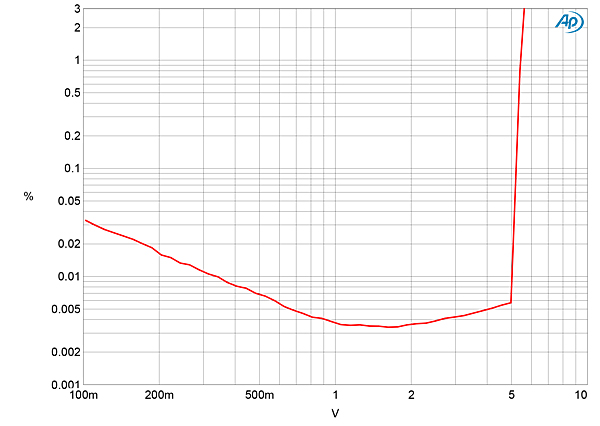
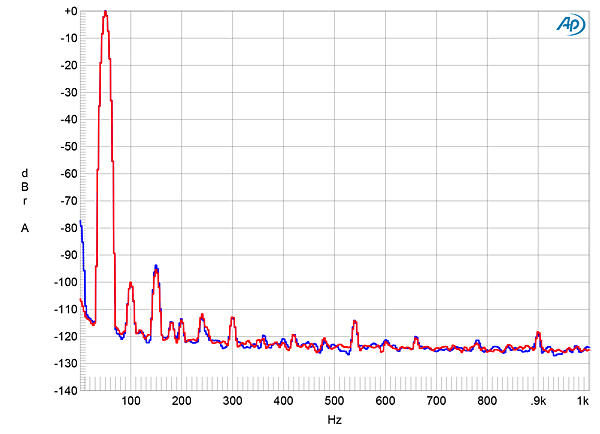
Channel separation via the analog line input (not shown) was almost as good as it was with digital input data, at >110dB below 5kHz and still 100dB at the top of the audioband. Fig.17 plots the THD+noise percentage in the balanced outputs against the analog input level. The output clips at 5.5V, which is equivalent to an analog input signal of 2.2V, as specified. As 2V is the Red Book–specified maximum output for CD players—the Ayre player that I used for my auditioning has a maximum single-ended output level of 2.103V—and 5.5V is just above the 0dBFS level for its digital inputs, the e1X's gain architecture is well-managed. The distortion via the analog inputs (fig.18) was slightly higher than it had been with the digital inputs but was still very low in absolute terms, with the third harmonic the highest in level, at –96dB (0.0015%). Intermodulation distortion was also extremely low (not shown).
Fig.17 Bel Canto e1X DAC, line analog input, THD+noise (%) vs 1kHz output voltage into 100k ohms.
Fig.18 Bel Canto e1X DAC, line analog input, spectrum of 50Hz sinewave, DC–1kHz, at 1V into 100k ohms (left channel blue, right red; linear frequency scale).
Fig.19 Bel Canto e1X DAC, phono input, response with RIAA correction (left channel blue, right red) (0.5dB/vertical div.).
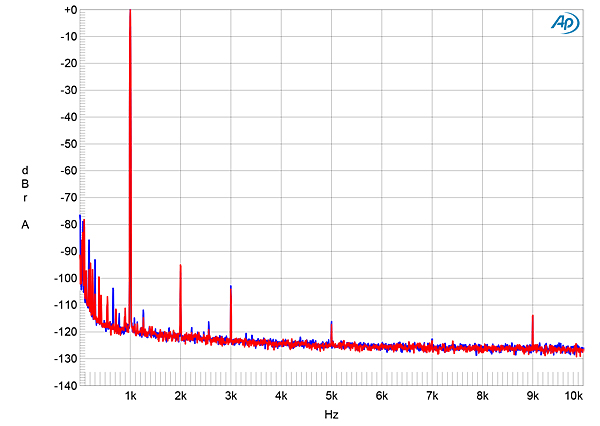
Fig.20 Bel Canto e1X DAC, phono input, 5.0mV sensitivity, spectrum of 1kHz sinewave, DC–10kHz, for 5mV input (left channel blue, right red, linear frequency scale).
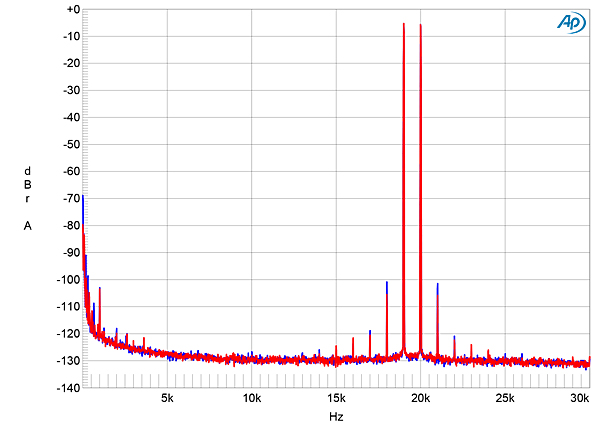
Fig.21 Bel Canto e1X DAC, phono input, 5.0mV sensitivity, HF intermodulation spectrum, DC–30kHz, 19+20kHz for 100mV peak input (left channel blue, right red, linear frequency scale).
The phono input's overload margins were good with both MM and MC gain settings, at close to 12dB across the audioband, ref. 1kHz at 5mV, with the gain set to "5.0mV" and 11dB, again across the audioband, ref. 1kHz at 0.5mV, with the gain set to "0.5mV." Harmonic distortion was very low, with the second harmonic the highest in level at just –96dB (0.0015%, fig.20). Intermodulation distortion was also low, even with an equal mix of 19kHz and 20kHz tones at an input level 4.6dB below the overload point (fig.21).—John Atkinson
Footnote 1: See, for example, fig.9 here.