| Columns Retired Columns & Blogs |
A Basshead's Delight: The V-Moda Crossfade M-100 Measurements
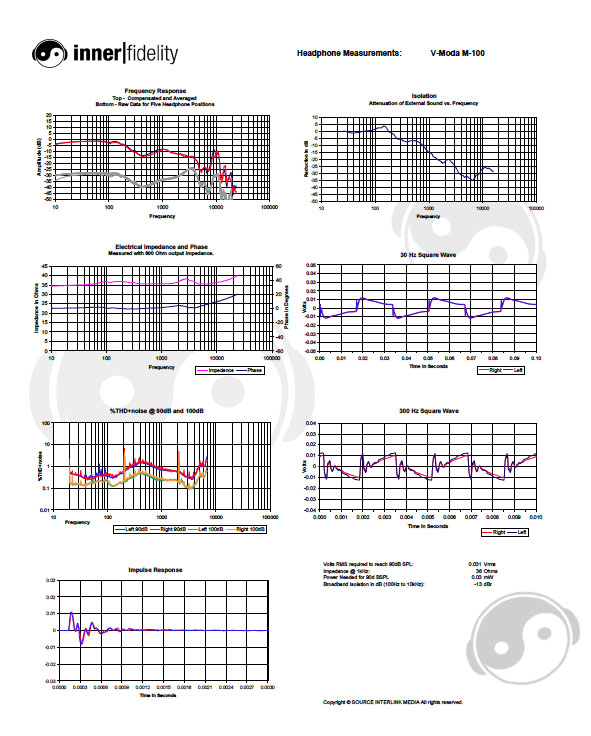
Click on graphs image to download .pdf for closer inspection.
Here's a perfect example of Steve Guttenberg's objection to headphone measurements for consumers. If I'd have seen these measurements prior to listening to these cans I wouldn't be able to tell if I would like them or not. They're quite good in some ways, and pretty odd in others.
Raw frequency response plots show these cans don't change much with positional changes, and the seal remains good throughout. Compensated frequency response plots show a headphone with a significant warm tilt overall, a mid-range depression, and an uneven response in the treble. Putting what I heard together with this plot, I think we see a roughly 8dB elevated bass below 200Hz, then a mid-range that's got an emphasized presence peak at 1kHz, followed by a reduced treble response with a sparkly peak at 10kHz. That 10kHz peak is usually very annoying to me in other cans that exhibit this feature, but it didn't bother me a bit with the M-100.
Worth noting since V-Moda claims to be very careful with consistant driver performance is the excellent channel matching with these cans. Not only in the FR plots but in all the plots on this page. It's certainly among the best I've seen and quite a nice result.
30Hz square wave shows the rounded leading edge of a punchy headphone with a significant leading edge spike give some detail to what otherwise can be a boring, rolled-off treble if not present. The long flat top after the hump in the beginning shows tight, extended bass response.
In the 300Hz square wave we can see this significant first peak and smaller secondary overshoot. Were the top of the waveform flat subsequent to these peaks, I'm sure I would have found them too strident. But the rising top after the initial peak, I believe, tends to balance things out.
The impulse response plot clearly shows a bit of ringing, and likely is the source of the slightly artificial sounding treble I heard in listening tests. The ring damps fairly rapidly however, which might make for the impression of sparkly highs as opposed to something more disturbing.
THD+noise plot shows midrange distortion slightly higher than normal, but bass distortion is much better than normal again indicating tight, clean bass. The 100dB plots being so cleanly below the 90dB plot indicate a headphone with excellent power handling ability. Yes, these cans remain pretty clean when played loud.
The impedance plot show a 35 Ohm headphone with little variation in impedance over frequency. This headphone will not change tonal character much when driven by relatively high output impedance portable players and smartphones.
The isolation plot shows about average isolation for a full-size sealed headphone. Broadband isolation is -13dB. The headphones take 31mVrms to reach 90dB indicating they'll easily reach loud volume levels on portable devices.
- Log in or register to post comments
