Sidebar 3: Measurements
I measured the Balanced Audio Technology VK-56SE using my Audio Precision SYS2722 system (see the January 2008 "As We See It"). The VK56-SE looks identical to the VK-55SE, which Wes Phillips reviewed in April 2010, and it was instructive to compare its measured performance with that of the earlier amplifier. Like the VK-55SE, the VK-56SE has four output terminals for each channel, various pairs of which can be used to provide a feed from three different output-transformer taps labeled High, Med, and Low. I performed a complete set of measurements from each tap, but have concentrated on the Low outputs in this discussion, as those were the taps preferred by Herb Reichert.
Both the small-signal and output tubes are delivered numbered, and I installed them from left to right, as instructed in the manual. The amplifier's maximum voltage gain from the High output tap was the same as the VK-55SE's and lower than the norm, at 24dB into 8 ohms. The gain from the Med tap was 23.2dB, and 23dB from the Low tap. Each output tap was non-inverting (ie, it preserved absolute polarity), with pin 2 of the XLR jacks wired hot. The input impedance was very high—a good thing—at 155k ohms across the audioband. (The figure is approximate because the margin of error is larger with extreme values such as this.)
The output impedance from the VK-56SE's High tap was both very high, at 6.7 ohms from low to high frequencies, and higher than that of the earlier amplifier. As a result of the Ohm's law interaction between the high output impedances and the impedance of our standard simulated loudspeaker, the amplifier's frequency response into this load varied by a very audible ±2.1dB from the High tap (fig.1, gray trace). The output impedance was lower from the Med and Low taps, at 5.5 and 3.35 ohms, respectively. The response from the Low tap with our simulated loudspeaker varied by ±1.5dB (fig.2, gray trace), compared with ±1.2dB for the VK-55SE. Into resistive loads, the VK-56SE offered a flat response in the audioband, with excellent channel matching and a wide small-signal bandwidth. The amplifier's ultrasonic response into 8 ohms didn't reach –3dB until 150kHz, which correlates with a very square squarewave response (fig.3). The waveform's risetimes are very short, and there is neither overshoot nor ringing.
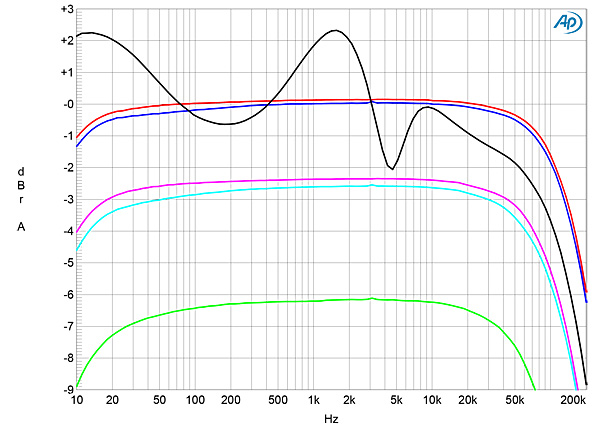
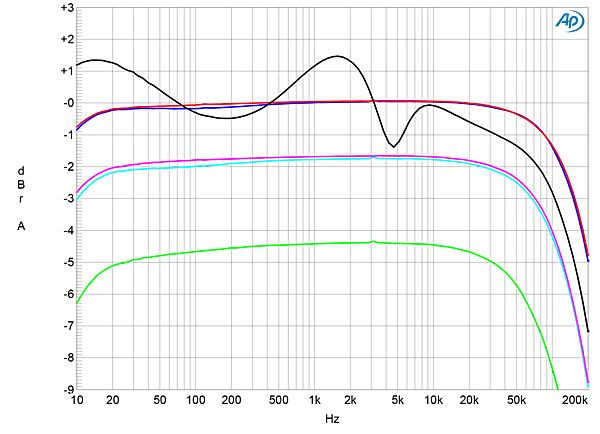
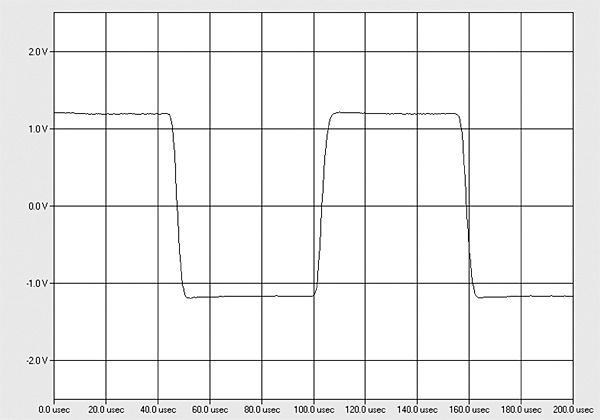
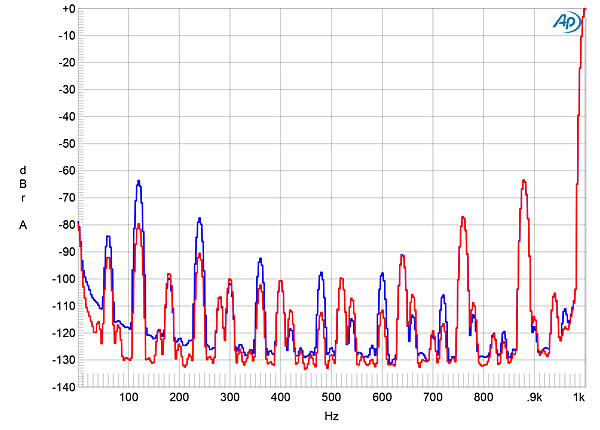
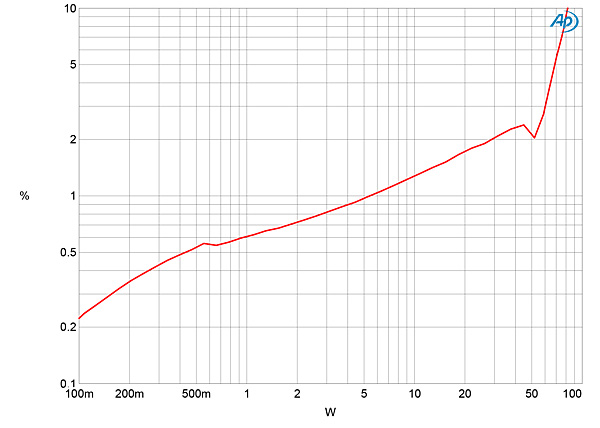
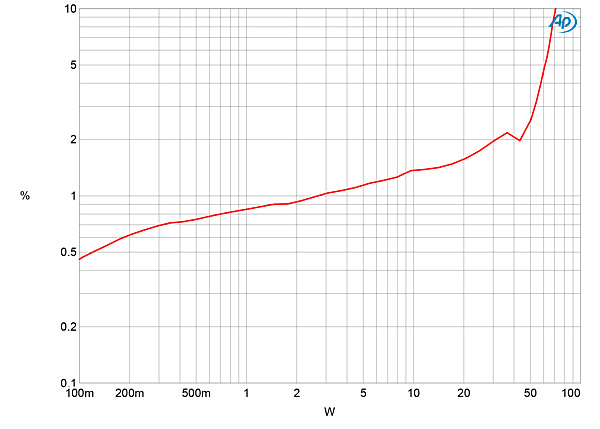
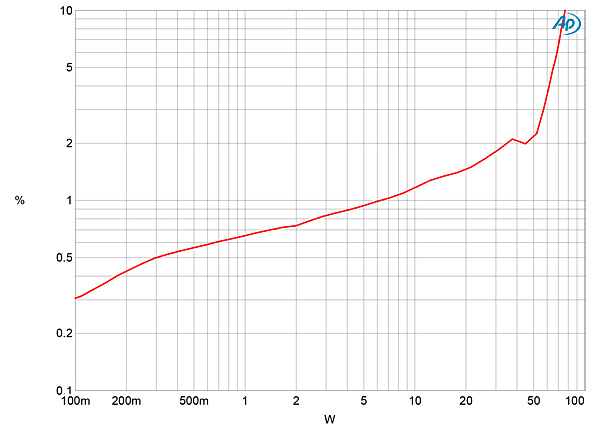
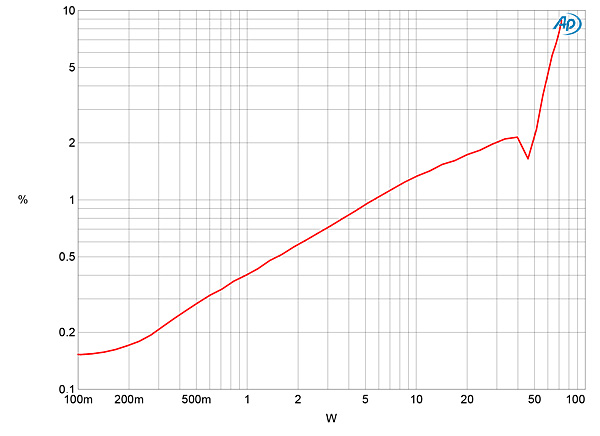
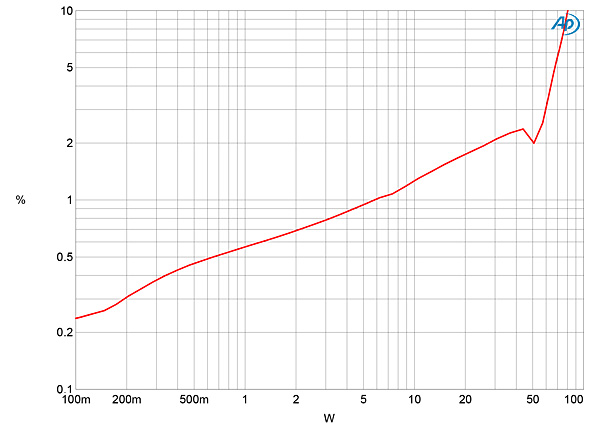
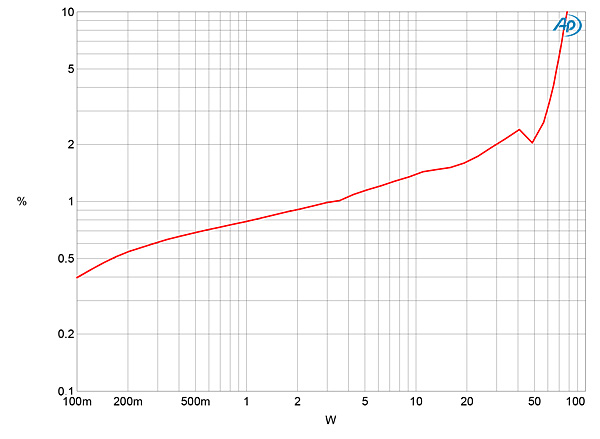
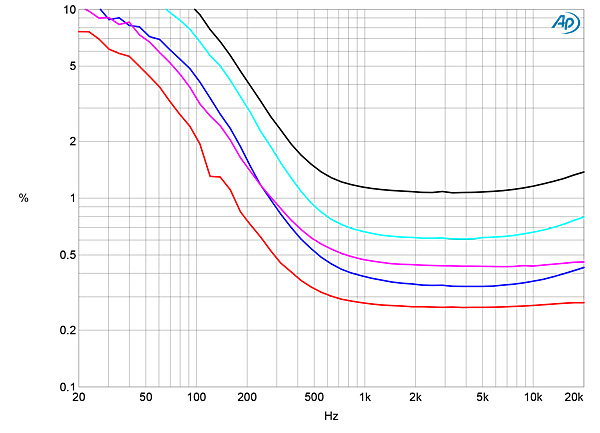
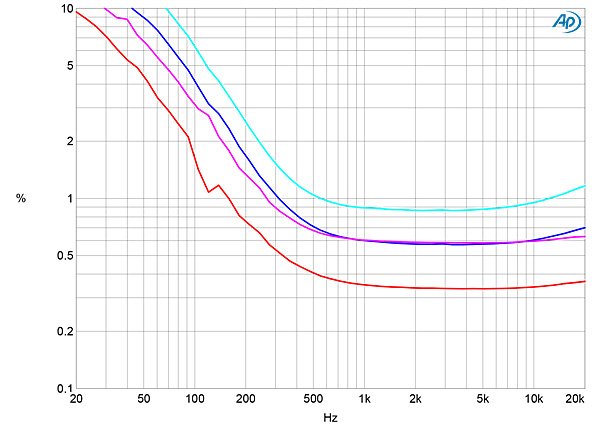
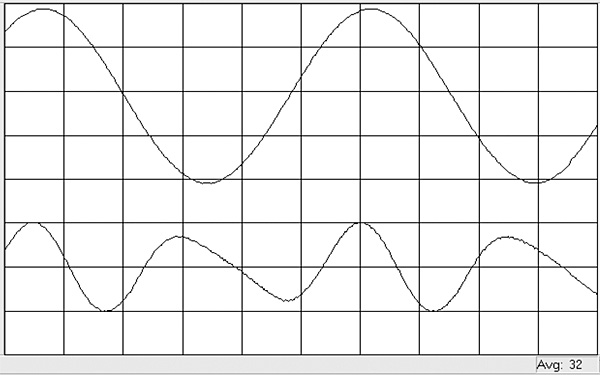

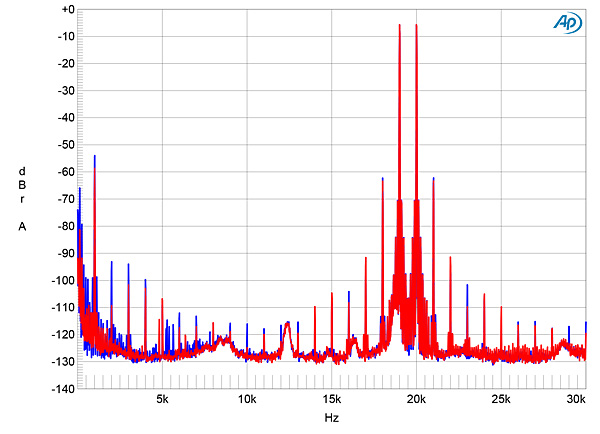
Fig.1 Balanced Audio Technology VK-56SE, High output tap, frequency response at 2.83V into: simulated loudspeaker load (gray), 8 ohms (left channel blue, right red), 4 ohms (left cyan, right magenta), 2 ohms (green) (1dB/vertical div.).
Fig.2 Balanced Audio Technology VK-56SE, Low output tap, frequency response at 2.83V into: simulated loudspeaker load (gray), 8 ohms (left channel blue, right red), 4 ohms (left cyan, right magenta), 2 ohms (green) (1dB/vertical div.).
Fig.3 Balanced Audio Technology VK-56SE, High output tap, small-signal 10kHz squarewave into 8 ohms.
Channel separation (not shown) was good, but not as good as that of the earlier amplifier, measuring >70dB in both directions below 3kHz, and decreasing to >58dB at the top of the audioband. The unweighted, wideband signal/noise ratio, measured at the High output tap and taken with the input shorted, was good at 79.2dB ref. 1W into 8 ohms in the right channel. It was worse in the left channel, however, measuring 67.5dB. When A-weighted, these ratios respectively improved to 96.2 and 83.3dB. The ratios from the Low tap were 1-2dB worse. The reason for the difference between the channels' ratios can be seen in fig.4, which shows the spectrum of the amplifier's output as it drove a 1kHz tone at 1W into 8 ohms from the High tap. Power-supply–related spuriae at 60 and 180Hz, and especially 120Hz, are up to 17dB higher in the left channel (blue trace) than the right (red). I checked the grounding between the amplifier and the Audio Precision analyzer, but couldn't get any lower noise than is shown in this graph.
Fig.4 Balanced Audio Technology VK-56SE, High output tap, spectrum of 1kHz sinewave, DC–1kHz, at 1W into 8 ohms (left channel blue, right red) (linear frequency scale).
Like the VK-55SE, the VK-56SE is specified as having a maximum output power of 55Wpc into 8 ohms (17.4dBW) at 3% THD+noise. The VK-56SE delivered 60Wpc into 8 ohms from its High tap (17.8dBW), 59Wpc from the Med tap (17.7dBW), and 54Wpc from the Low tap, all at 3% THD+N. However, the distortion at lower powers was higher than I like to see, as can be seen in fig.5, which plots the THD+N percentage against output power into 8 ohms from the High tap. The steady rise in THD with power before actual waveform clipping is reached suggests that this amplifier uses only a modest amount of loop negative feedback. The 4 ohms delivery from the High output was similar (fig.6), though the power at 1% THD+N dropped from 5.3Wpc into 8 ohms to 3.1Wpc into 4 ohms. The Med tap delivered slightly more power at 1% THD+N into 4 ohms (7Wpc, 15dBW), and 54Wpc at 3% THD+N (14.55dBW, fig.7). Fig.8 plots the THD+N percentage against output power from HR's preferred Low tap into 8 ohms, and shows that the low-level distortion is lower than from the other two taps, even into 4 ohms (fig.9). However, into 2 ohms from the Low tap (fig.10), the distortion at low powers was the same as from the High tap into 8 ohms.
Fig.5 Balanced Audio Technology VK-56SE, High output tap, THD+N (%) vs 1kHz continuous output power into 8 ohms.
Fig.6 Balanced Audio Technology VK-56SE, High output tap, THD+N (%) vs 1kHz continuous output power into 4 ohms.
Fig.7 Balanced Audio Technology VK-56SE, Med output tap, THD+N (%) vs 1kHz continuous output power into 4 ohms.
Fig.8 Balanced Audio Technology VK-56SE, Low output tap, THD+N (%) vs 1kHz continuous output power into 8 ohms.
Fig.9 Balanced Audio Technology VK-56SE, Low output tap, THD+N (%) vs 1kHz continuous output power into 4 ohms.
Fig.10 Balanced Audio Technology VK-56SE, Low output tap, THD+N (%) vs 1kHz continuous output power into 2 ohms.
The VK-55SE's two channels had differed in their small-signal linearity, which I'd conjectured was due to our review sample's tubes having had a lot of mileage on them. However, the VK-56SE behaved similarly. Fig.11 plots the THD+N percentage against frequency from the Low tap at 2.83V into 8, 4, and 2 ohms. Into the two higher impedances, the right channel (red and magenta traces) offered lower distortion in the midrange and treble than the left (blue, cyan), and into 2 ohms the left channel's THD+N remained above 1% (gray). However, both channels offered higher levels of distortion as the frequency dropped, this presumably due to the onset of core saturation in the output transformers, and this behavior was more extreme from the High tap (fig.12).
Fig.11 Balanced Audio Technology VK-56SE, Low output tap, THD+N (%) vs frequency at 2.83V into: 8 ohms (left channel blue, right red), 4 ohms (left cyan, right magenta), 2 ohms (gray).
Fig.12 Balanced Audio Technology VK-56SE, High output tap, THD+N (%) vs frequency at 2.83V into: 8 ohms (left channel blue, right red), 4 ohms (left cyan, right magenta), 2 ohms (gray).
Such high levels of distortion won't necessarily result in poor sound quality if the harmonics present are low-order. This would appear to be case from the waveform of the distortion content (fig.13, lower trace), taken at 1W into 8 ohms from the High output, which appears to be predominantly second-harmonic in nature. This is confirmed by the spectrum of the VK-56SE's output at the same power from the Low tap (fig.14), though the third harmonic is only 7dB lower than the second. Although high-order harmonics are also present, these all lie at or below –80dB (0.01%).
Fig.13 Balanced Audio Technology VK-56SE, High output tap, 1kHz waveform at 1W into 8 ohms (top), 0.69% THD+N; distortion and noise waveform with fundamental notched out (bottom, not to scale).
Fig.14 Balanced Audio Technology VK-56SE, Low output tap, spectrum of 1kHz sinewave, DC–10kHz, at 1W into 8 ohms (left channel blue, right red; linear frequency scale).
Finally, as implied by the fact that the distortion percentage doesn't rise at the top of the audioband in fig.11, the VK-56SE did okay on the demanding twin-tone test of high-frequency intermodulation (fig.15). At 1Wpc into 8 ohms from the Low tap, the 1kHz difference tone was the highest in level, at –54dB (0.2%) in the left channel (blue trace) and –57dB (0.14%) in the right (red). As had been the case with the VK-55SE, the higher-frequency tones in this spectrum are surrounded by sideband pairs at ±120Hz and its harmonics, suggesting that the amplifier's power supply is being stressed under these conditions.
Fig.15 Balanced Audio Technology VK-56SE, Low output tap, HF intermodulation spectrum, DC–24kHz, 19+20kHz at 1W peak into 8 ohms (linear frequency scale).
Overall, though the VK-56SE measured similarly to its predecessor, some aspects of its measured performance—the high output impedance, the differences in noise and linearity between channels—bothered me. But I'm not surprised that HR preferred using the amplifier's Low output transformer taps; these give the best measured performance, especially into lower impedances, while preserving the "tube amplifier" character.—John Atkinson