 Turning to the AVM AS 5.3's digital inputs, I used optical and coaxial S/PDIF data to examine their behavior. I used network data played with Roon to evaluate the streaming (Ethernet) input. The coaxial input locked to data with a sample rate of 192kHz, the TosLink input was limited to 96kHz, and the Roon app indicated that the amplifier would accept 32-bit network data with sample rates up to 384kHz. The digital inputs preserved absolute polarity at all the outputs.
With the volume control set to the maximum, the output level with a 1kHz tone at –30dBFS was 82.4mV from the LINE output, 703mV from the PRE output, 1.46V from the headphone output, all into 100k ohms, and 22.04V from the loudspeaker output into 8 ohms. The last is just 6dB below the clipping voltage into 8 ohms. The digital input gain trim can be set between 9.5dB and –9.5dB; the latter should probably be used. I examined the digital inputs' behavior at the PRE output with the volume control set to –12dB in order to avoid overloading the output stage. (The PRE output clipped at 10V into 100k ohms.)
Turning to the AVM AS 5.3's digital inputs, I used optical and coaxial S/PDIF data to examine their behavior. I used network data played with Roon to evaluate the streaming (Ethernet) input. The coaxial input locked to data with a sample rate of 192kHz, the TosLink input was limited to 96kHz, and the Roon app indicated that the amplifier would accept 32-bit network data with sample rates up to 384kHz. The digital inputs preserved absolute polarity at all the outputs.
With the volume control set to the maximum, the output level with a 1kHz tone at –30dBFS was 82.4mV from the LINE output, 703mV from the PRE output, 1.46V from the headphone output, all into 100k ohms, and 22.04V from the loudspeaker output into 8 ohms. The last is just 6dB below the clipping voltage into 8 ohms. The digital input gain trim can be set between 9.5dB and –9.5dB; the latter should probably be used. I examined the digital inputs' behavior at the PRE output with the volume control set to –12dB in order to avoid overloading the output stage. (The PRE output clipped at 10V into 100k ohms.)
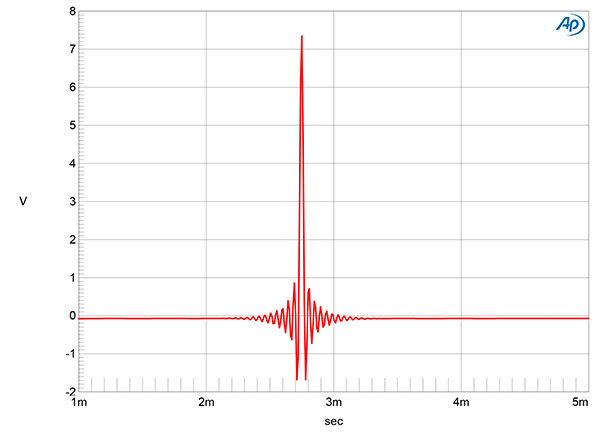
Fig.11 AVM AS 5.3, digital inputs, Steep filter, impulse response (one sample at 0dBFS, 44.1kHz sampling, 4ms time window).
The AVM AS 5.3 offers a choice of two digital reconstruction filters, labeled Steep and Smooth. The Steep filter's impulse response with 44.1kHz data (fig.11) revealed that this filter is a long linear-phase type, with symmetrical ringing before and after the single sample at 0dBFS. The Smooth impulse response (not shown) was typical of a short linear-phase filter.
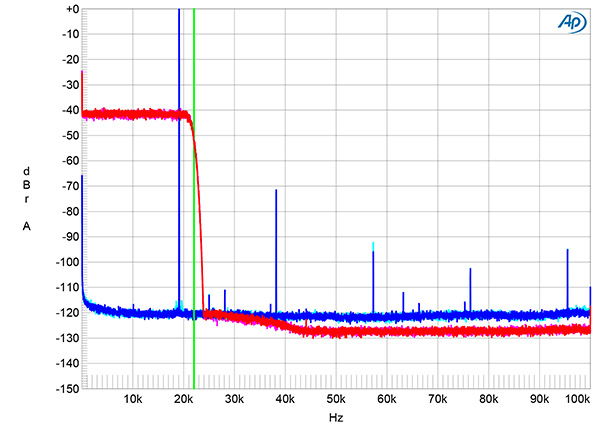
Fig.12 AVM AS 5.3, digital inputs, Steep filter wideband spectrum of white noise at –4dBFS (left channel red, right magenta) and 19.1kHz tone at 0dBFS (left blue, right cyan) with data sampled at 44.1kHz (20dB/vertical div.).
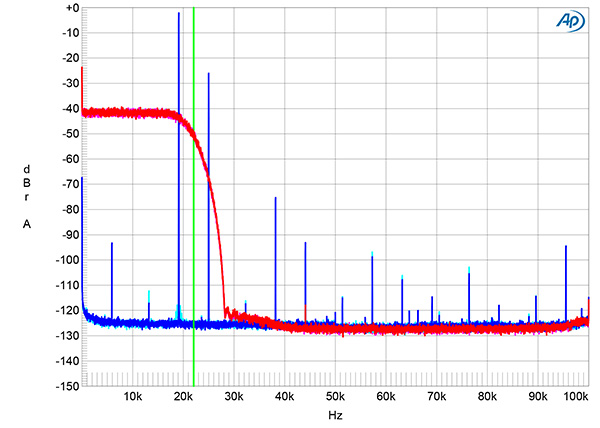
Fig.13 AVM AS 5.3, digital inputs, Smooth filter wideband spectrum of white noise at –4dBFS (left channel red, right magenta) and 19.1kHz tone at 0dBFS (left blue, right cyan) with data sampled at 44.1kHz (20dB/vertical div.).
The magenta and red traces in fig.12 show the ultrasonic rolloff of the AVM AS 5.3's Steep filter with white-noise data sampled at 44.1kHz. The traces reach full stop-band attenuation at 24kHz, just above half the sample rate, which is indicated by the vertical green line. The aliased image at 25kHz of a 19.1kHz tone at 0dBFS (cyan, blue) is almost completely suppressed. Repeating this spectral analysis with the Smooth filter (fig.13) gave a slower ultrasonic rolloff with the white-noise signal, and the aliased image of the 19.1kHz tone lay at –26dB.
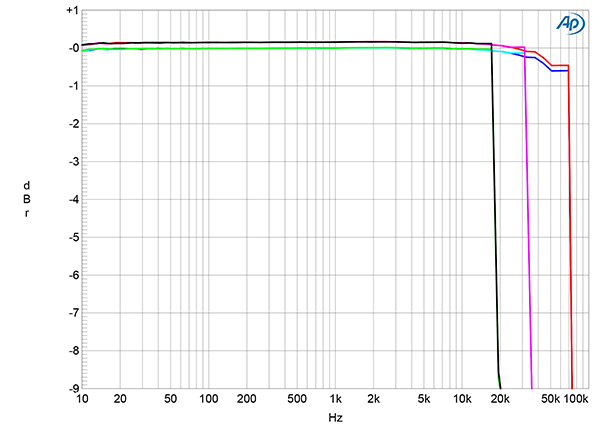
Fig.14 AVM AS 5.3, digital inputs, Steep filter, frequency response at –12dBFS with data sampled at: 44.1kHz (left channel green, right gray), 96kHz (left cyan, right magenta), and 192kHz (left blue, right red) (1dB/vertical div.).
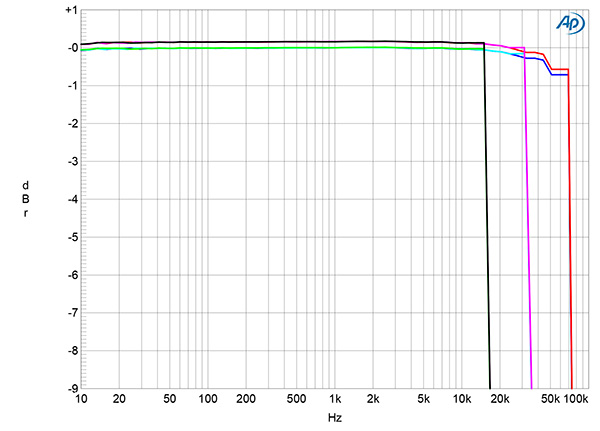
Fig.15 AVM AS 5.3, digital inputs, Smooth filter, frequency response at –12dBFS with data sampled at: 44.1kHz (left channel green, right gray), 96kHz (left cyan, right magenta), and 192kHz (left blue, right red) (1dB/vertical div.).
The Steep filter's digital frequency response with data sampled at 44.1kHz, 96kHz, and 192kHz (fig.14) was flat in the audioband with a sharp rolloff just below half of each sample rate. The Smooth filter's frequency response (fig.15) rolled off earlier at all three sample rates; with 44.1kHz data (green and gray traces) the response was down by 10dB at 16kHz.
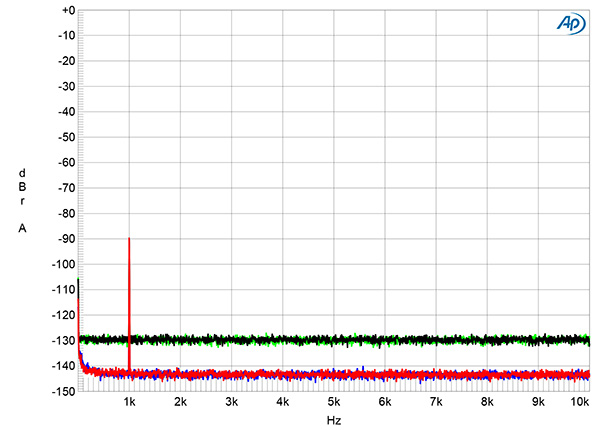
Fig.16 AVM AS 5.3, digital inputs, spectrum with noise and spuriae of dithered 1kHz tone at –90dBFS with: 16-bit data (left channel green, right gray), 24-bit data (left blue, right red) (20dB/vertical div.).
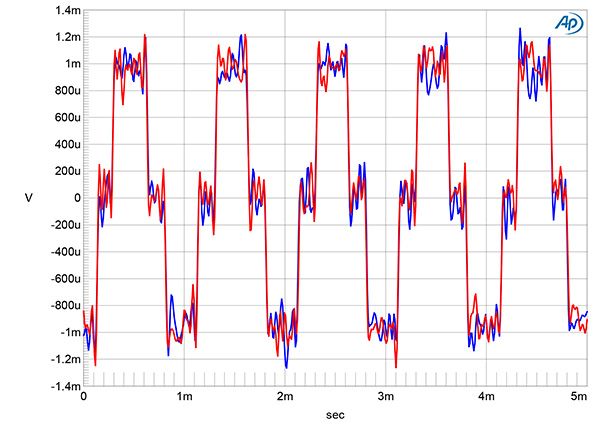
Fig.17 AVM AS 5.3, waveform of undithered 16-bit, 1kHz sinewave at –90.31dBFS (left channel blue, right red).
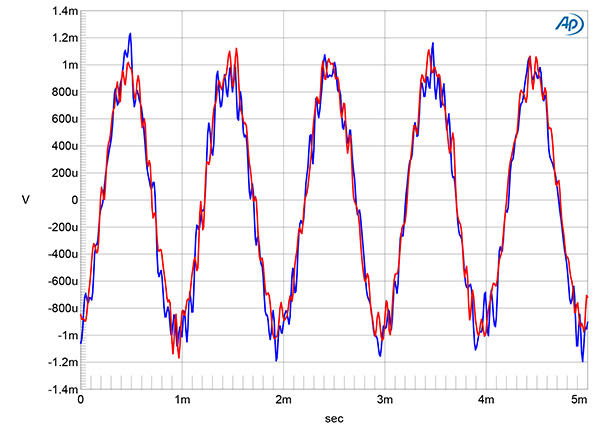
Fig.18 AVM AS 5.3, waveform of undithered 24-bit, 1kHz sinewave at –90.31dBFS (left channel blue, right red).
An increase in bit depth from 16 to 24, with dithered data representing a 1kHz tone at –90dBFS and the volume control set to –12dB, dropped the AVM AS 5.3's noisefloor by 12dB (fig.16), which implies a measured resolution of 18 bits. With undithered data representing a tone at exactly –90.31dBFS, the waveform was symmetrical, with negligible DC offset, and the three DC voltage levels described by the data were clearly defined (fig.17). With undithered 24-bit data (not shown), the AVM AS 5.3 output a relatively clean sinewave (fig.18).
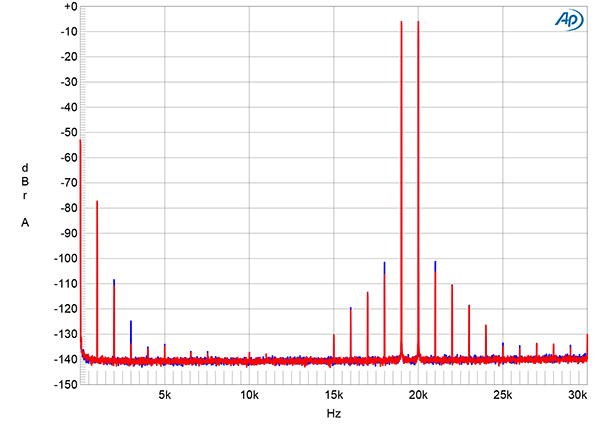
Fig.19 AVM AS 5.3, digital inputs, Steep filter, HF intermodulation spectrum, DC–30kHz, 19+20kHz at 0dBFS peak (left channel blue, right red, linear frequency scale).
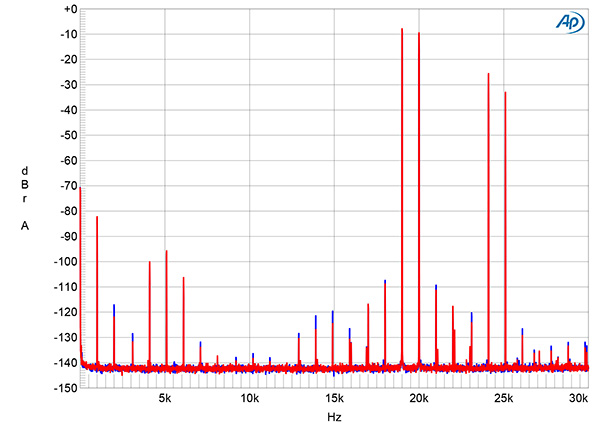
Fig.20 AVM AS 5.3, digital inputs, Smooth filter, HF intermodulation spectrum, DC–30kHz, 19+20kHz at 0dBFS peak (left channel blue, right red, linear frequency scale).
When I examined the AVM AS 5.3's intermodulation distortion with 24-bit data representing an equal mix of 19 and 20kHz tones, each at –6dBFS, the two reconstruction filters offered different behavior. Aliased images were not present with the Steep filter (fig.19) but were present with the Smooth filter (fig.20). Actual intermodulation distortion products were lower with the Smooth filter than with the Steep filter, presumably due to the premature top-octave rolloff seen in fig.14.
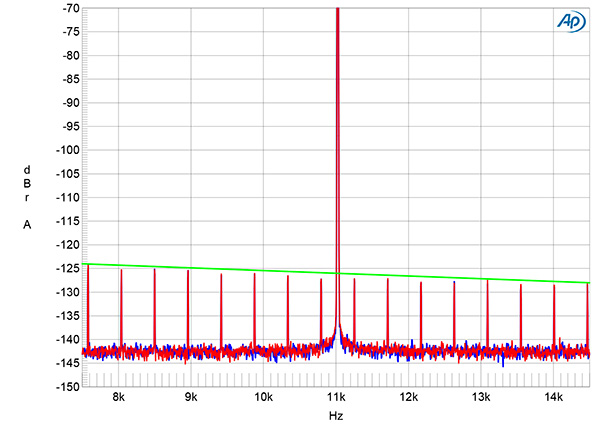
Fig.21 AVM AS 5.3, high-resolution jitter spectrum of analog output signal, 11.025kHz at –6dBFS, sampled at 44.1kHz with LSB toggled at 229Hz: 16-bit TosLink S/PDIF data (left channel blue, right red). Center frequency of trace, 11.025kHz; frequency range, ±3.5kHz.
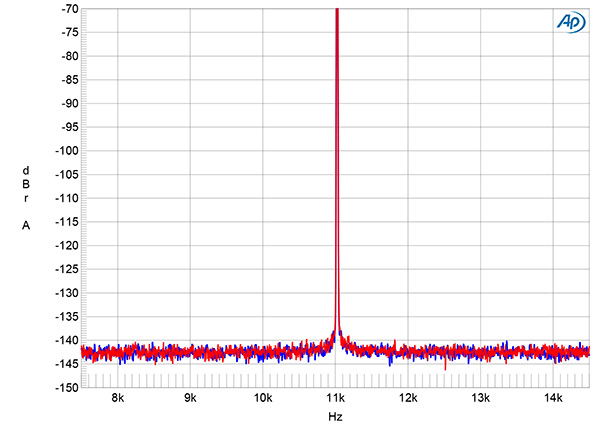
Fig.22 AVM AS 5.3, high-resolution jitter spectrum of analog output signal, 11.025kHz at –6dBFS, sampled at 44.1kHz with LSB toggled at 229Hz: 24-bit TosLink S/PDIF data (left channel blue, right red). Center frequency of trace, 11.025kHz; frequency range, ±3.5kHz.
When the AVM AS 5.3 was fed 16-bit optical or network J-Test data, the odd-order harmonics of the undithered low-frequency, LSB-level squarewave all lay at the correct levels, shown by the green line in fig.21. With 24-bit J-Test data (fig.22), no jitter sidebands were present, and the central spectral spike representing the high-level tone at one-quarter the sample rate was appropriately narrow.
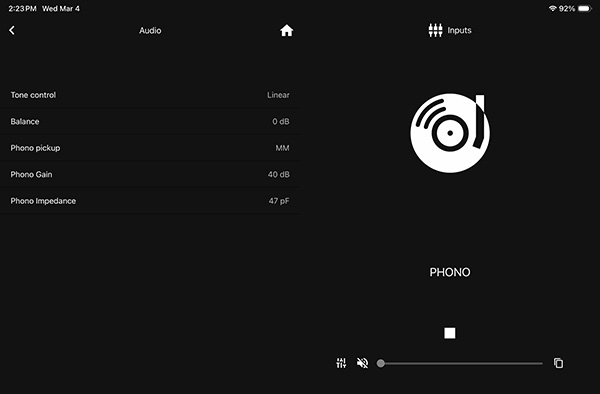 The AVM AS 5.3's phono input can be set to moving coil (MC) or moving magnet (MM). Both modes preserved absolute polarity at all four output types. The MM input impedance was 45k ohms at 20Hz and 1kHz and 40k ohms at 20kHz. The MC input impedance is specified as 330 ohms; I measured 345 ohms from 20Hz to 20kHz.
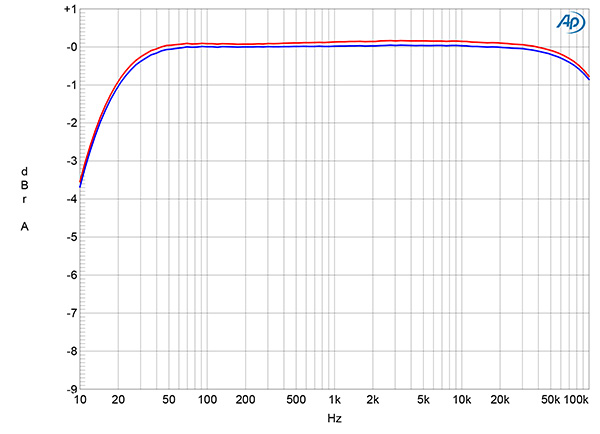
Fig.23 AVM AS 5.3, MM phono input, response with RIAA correction (left channel blue, right red) (1dB/vertical div.).
The AVM AS 5.3's RIAA equalization, measured in MM mode (fig.23), was accurate, with very close channel matching, and rolling off in the low bass to reach –3dB at 12Hz. The AVM AS 5.3 phono stage's unweighted, wideband S/N ratio in MM mode and 40dB gain, measured at the headphone output with the input shorted to ground and the volume control set to the maximum, was a very good 77.8dB in both channels ref. 1kHz at 5mV. Restricting the measurement bandwidth to 22Hz– 22kHz increased the ratio by 2.5dB, while the A-weighted ratio was 82.5dB. The S/N ratios in MC mode, ref. 1kHz at 500µV, were around 8dB lower but still good.
I measured the AVM AS 5.3 phono input's overload margins with the volume control set to –20dB to make sure I was looking at actual input overload rather than output stage clipping. The margins in MM mode set to 40dB gain were an excellent 25.5dB at 20Hz and 1kHz, and 15.6dB at 20kHz, all ref. 1kHz at 5mV. The margins in MC mode set to 60dB gain, ref. 500µV at 1kHz, were 26dB from 20Hz to 20kHz. Harmonic distortion was low, with the second harmonic the highest in level, at –69dB (0.03%) ref. 15mV input in MM mode. Intermodulation distortion was also low in level; the difference product at 1kHz with an equal mix of 19kHz and 20kHz tones, with a peak level of 150mV in MM mode, lay at –69dB.