| Columns Retired Columns & Blogs |
Acoustic Energy AE1 Mk.III Reference Special Edition loudspeaker Measurements
Sidebar 3: Measurements
Despite its small size, the Acoustic Energy AE1 Mk.III Special Edition was usefully more sensitive than the BBC LS3/5A, at an estimated 85dB(B)/2.83V/m, though this is still lower than average. The speaker's impedance drops below 6 ohms only in the lower midrange and the mid-treble, with a minimum value of 5.1 ohms at 190Hz (fig.1). As a result, the AE1 shouldn't be too hard to drive, though the combination of 6 ohms magnitude and –35° phase angle at 140Hz and 3.8kHz will mean that the speaker will work best with a good 4 ohm-rated amplifier. The shape of the impedance-magnitude trace does suggest that tube amplifiers be avoided, their high output impedance resulting in too much upper-midrange energy.
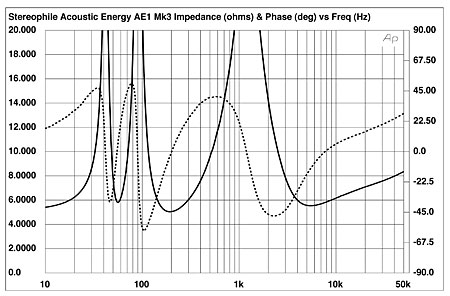
Fig.1 Acoustic Energy AE1 Mk.III SE, electrical impedance (solid) and phase (dashed). (5 ohms/vertical div.)
The impedance traces are free from the wrinkles and discontinuities that would suggest the presence of cabinet resonances. Nevertheless, I did find two fairly strong vibrational modes present on all surfaces, at 520 and 594Hz (fig.2). Given the small radiating areas of the panels and the relatively high frequencies of these resonances, it is likely that they won't introduce coloration. Certainly I wasn't aware of any lack of midrange clarity that might have resulted from them.
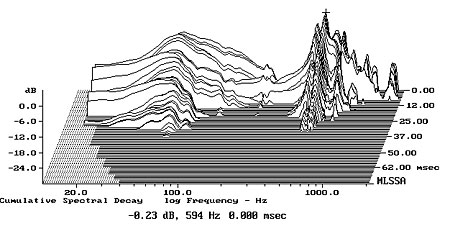
Fig.2 Acoustic Energy AE1 Mk.III SE, cumulative spectral-decay plot calculated from output of accelerometer fastened to center of top panel (MLS driving voltage to speaker, 7.55V; measurement bandwidth, 2kHz).
The saddle centered at 56Hz in the impedance-magnitude trace suggests that this is the tuning frequency of the small, rear-facing port. This was confirmed by the fact that the minimum-motion notch in the woofer's nearfield output (fig.3, blue trace) also occurs at 56Hz, and the port's output (red) peaks sharply in that region. The port's upper-frequency rolloff is smooth and well controlled, and though a couple of peaks can be seen between 750 and 950Hz, these are well down in level. The black trace below 300Hz is the complex sum of the woofer and port responses; it rolls off sharply below the port tuning frequency, and while much of the upper-bass boost is due to the nearfield measurement technique, the AE1's low-frequency alignment is a little underdamped.
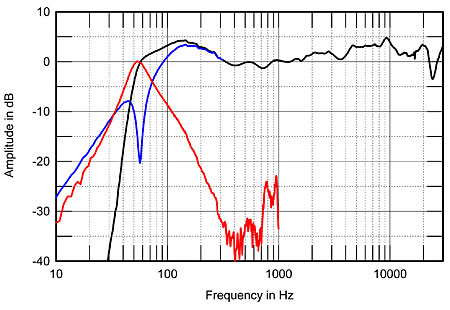
Fig.3 Acoustic Energy AE1 Mk.III SE, anechoic response on tweeter axis at 50", averaged across 30° horizontal window and corrected for microphone response, with nearfield responses of woofer (blue) and port (red) and their complex sum (black) plotted below 300Hz, 1kHz, and 300Hz, respectively.
Above 300Hz, the black trace in fig.3 shows the AE1's farfield response averaged across a 30° horizontal angle centered on the tweeter axis. The Mk.III SE shows much better integration of the two drive-units' outputs in the crossover region than the original AE1 (see fig.3 in my review). The Mk.III's midrange and treble are impressively smooth, but the speaker's output does gently rise by 4dB between 800Hz and 10kHz, relieved only by a slight dip between 3 and 4kHz. The ring-radiator tweeter's output extends at almost full level to 20kHz.
Fig.4 shows the AE1 Mk.III's lateral dispersion, normalized to the response on the tweeter axis, which therefore appears as a straight line. While there appear to be slight off-axis flares just below 1kHz and at the bottom of the tweeter's passband, these are actually due to the on-axis dips filling in to the speaker's sides. The Acoustic Energy's lateral dispersion is smooth and even, which correlates with the stable, well-defined stereo imaging I noted in my auditioning. While the tweeter does become more directional above 10kHz, its output doesn't drop as quickly off axis as with many 1" dome units. In the vertical plane (fig.5), deep suckouts appear at 2.7kHz at greater than 15° above and 25° below the tweeter axis, but the AE1 isn't otherwise all that critical regarding the exact listening axis.
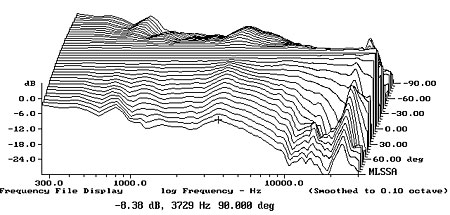
Fig.4 Acoustic Energy AE1 Mk.III SE, lateral response family at 50", normalized to response on tweeter axis, from back to front: differences in response 90–5° off axis, reference response, differences in response 5–90° off axis.
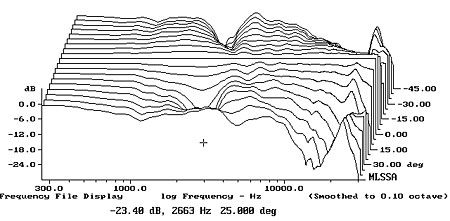
Fig.5 Acoustic Energy AE1 Mk.III SE, vertical response family at 50", normalized to response on tweeter axis, from back to front: differences in response 45–5° above axis, reference response, differences in response 5–45° below axis.
Fig.6 shows how the Acoustic Energy's response and dispersion measurements add up in the listening room. (I derive this graph by averaging 20 measurements taken for each speaker in a rectangular grid measuring 36" by 18" and centered on the position of my ears in my listening chair. I used an Earthworks omni microphone and a Metric Halo ULN-2 FireWire audio interface, in conjunction with SMUGSoftware's Fuzzmeasure 2.0 running on my Apple laptop.) The dip at 200Hz is due to the usual interference from the "floor bounce," but is not severe. The upper bass is indeed a little rich, and the lows roll off below 60Hz, with the 32Hz band reinforced only a little by my room's fundamental resonant mode. Higher in frequency, the in-room curve is remarkably flat, with just a slight excess of energy apparent in the octave between 4 and 8kHz. In this respect, the Mk.III SE's in-room behavior is very similar to both of the earlier versions I reviewed. Ideally, however, the top two octaves should slope down gently, due to the increased absorption of the room furnishings in this region. The AE1 Mk.III SE's gently rising on-axis response and its wide, even dispersion resulted in too much treble energy in my listening room. Only in a very large room would the speaker's high frequencies be in better balance with its midrange, but a pair of small speakers would not drive a larger room to satisfactory SPLs.
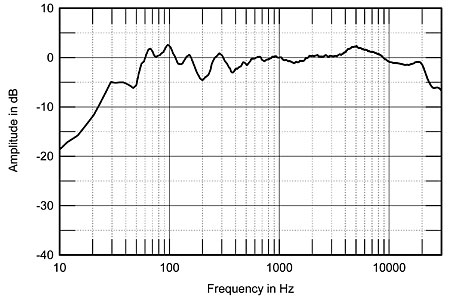
Fig.6 Acoustic Energy AE1 Mk.III SE, spatially averaged, 1/6-octave response in JA's listening room.
For reference, the Acoustic Energy's spatially averaged in-room response is shown in fig.7 (red trace), along with the responses of the PSB Imagine B (blue) and Spendor SA1 (green). (To better reveal their details, these traces are plotted on an expanded scale compared with fig.6.) The PSB and Acoustic Energy are very similar in the lower midrange and below, compared with the prematurely rolled-off low frequencies of the Spendor. The AE1 and SA1 are actually very similar in the upper midrange, the PSB being a little too forward, while in the top octaves, the Spendor can be seen to have a mellower balance than the other two speakers. But again, fig.7 makes it clear that the Acoustic Energy has more mid-treble energy than either the Spendor or the PSB. This is probably why it was unforgiving of recordings that were themselves too bright.
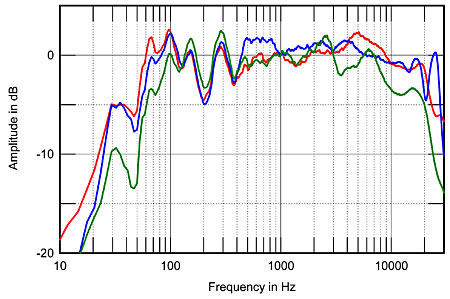
Fig.7 Acoustic Energy AE1 Mk.III SE, spatially averaged, 1/6-octave response in JA's listening room (red); spatially averaged, 1/6-octave response of PSB Imagine B (blue) and Spendor SA1 (green). (5dB vertical div.)
The AE1 Mk.III is specified as having a second-order crossover, which usually means that the drive-units are connected in opposite polarity to give a smooth transition between them in the frequency domain. However, the Special Edition's step response on its tweeter axis (fig.8) indicates that the tweeter and woofer are both connected in positive acoustic polarity. The tweeter's step smoothly blends with that of the woofer, confirming the good frequency-domain integration of their outputs seen in fig.3. Finally, the AE1's cumulative spectral-decay plot (fig.9) is superbly clean across the entire audioband. The speaker's balance may be on the bright side, but it is also free from grain and coloration-inducing resonances.—John Atkinson
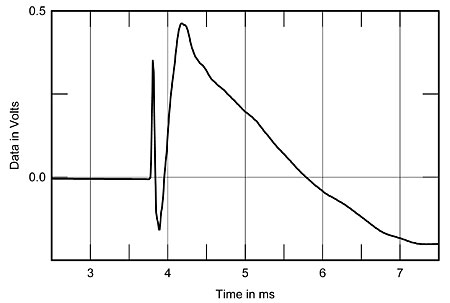
Fig.8 Acoustic Energy AE1 Mk.III SE, step response on tweeter axis at 50" (5ms time window, 30kHz bandwidth).
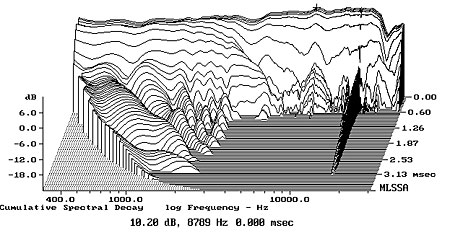
Fig.9 Acoustic Energy AE1 Mk.III SE, cumulative spectral-decay plot on tweeter axis at 50" (0.15ms risetime).
- Log in or register to post comments
