Sidebar 3: Measurements
I measured the first sample of the WiiM Mini with my Audio Precision SYS2722 system, repeating some tests with the second sample. Looking first at the WiiM's analog inputs and outputs, the input impedance was a usefully high 32k ohms at 20Hz and 1kHz, 13k ohms at 20kHz. The analog output preserved absolute polarity (ie, it was noninverting), and the source impedance was a low 33 ohms from 20Hz to 20kHz. The gain was 0.37dB with the fixed gain set to "1V." With the fixed gain set to "2V (Loud)," the gain was 5.8dB at the outputs; that is, an input of 1V resulted in an output of 1.955V.
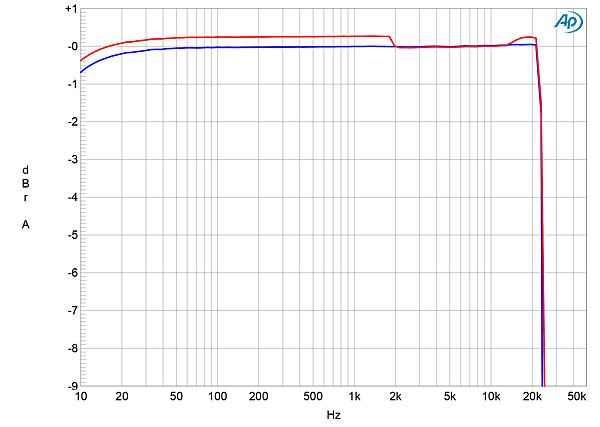
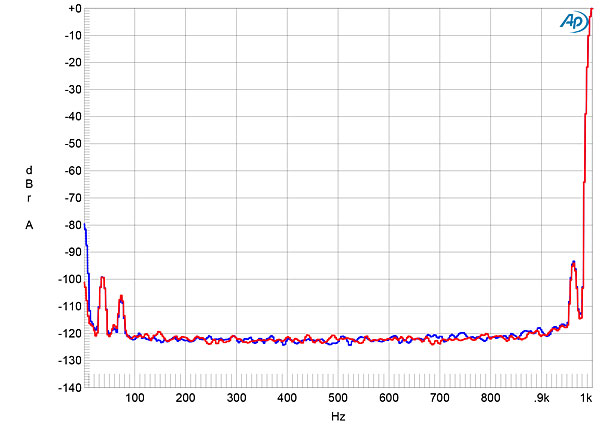
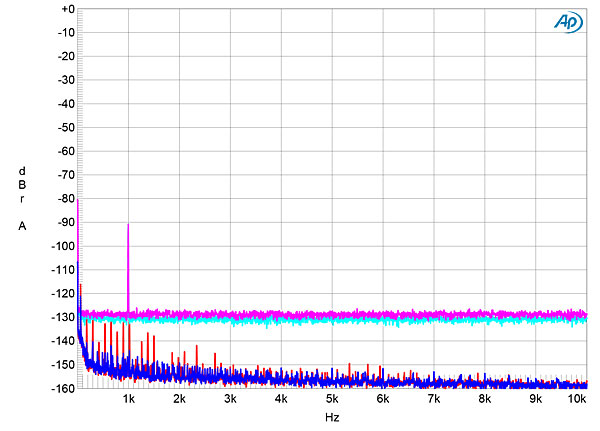
The analog input offered a frequency response that rolled off rapidly above 21kHz (fig.1), which is due to analog input signals being digitized at a sample rate of 48kHz. The right-channel response (red trace) had a +0.2dB plateau below 2kHz and at the top of the audioband. Channel separation (not shown) was excellent, at >110dB below 1kHz and still 90dB at the top of the audioband. The low-frequency noisefloor (fig.2) was free from power supply–related spuriae, but low-level components of unknown origin were present at 36Hz, 72Hz, and 964Hz.
 The WiiM Mini's TosLink output was bit-accurate. I examined the amount of timing uncertainty—jitter—in the TosLink output using my Audio Precision SYS2722 system's digital oscilloscope function. I overlaid successive snapshots of the Mini's digital output, taken over a 60s time window, to show what's called an "eye pattern." All the pulse transitions in the datastream should overlay one another to produce an image of a wide-open "eye," with just one trace visible. This was the case with the Mini (fig.12) with the original 44.1kHz data plotted over one "unit cycle." The eye is wide open, with no blurring of the leading and trailing edges. The average jitter level, assessed with a 50Hz–100kHz bandwidth, was a relatively low 729.7 picoseconds, though with typical music recordings it averaged 1.6 nanoseconds.
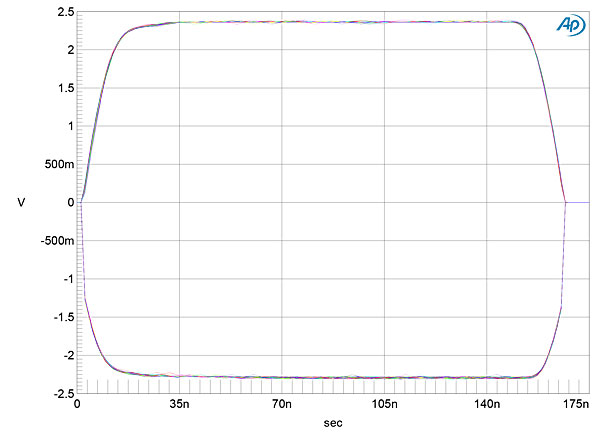
Fig.1 WiiM Mini, analog input, frequency response at 1V into 100k ohms (left channel blue, right red; 1dB/vertical div.).
Fig.2 WiiM Mini, analog input, 2V output setting, spectrum of 1kHz sinewave, DC–1kHz, at 2V into 100k ohms (left channel blue, right red; linear frequency scale).
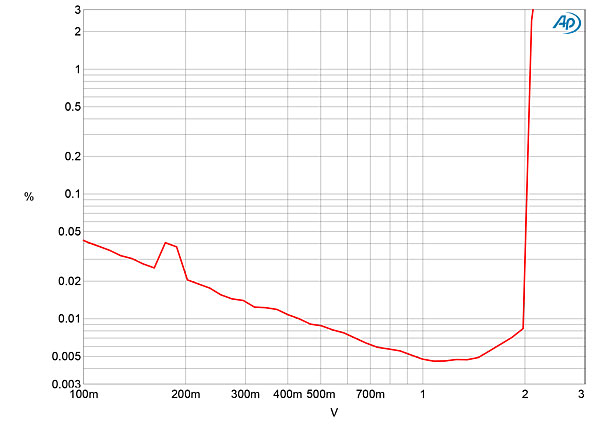
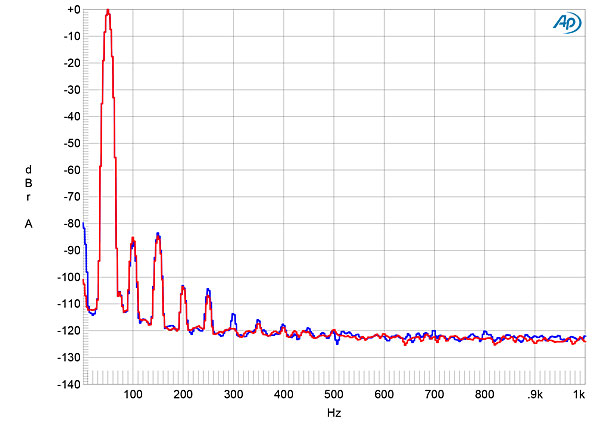
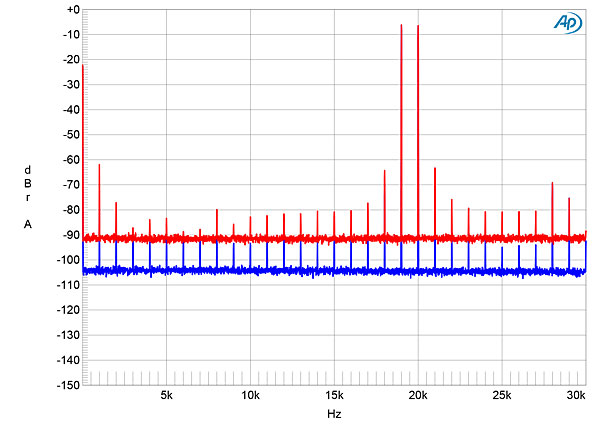
Fig.3 plots the percentage of THD+noise in the Mini's output against the output voltage into 100k ohms. The fixed gain was set to "2V" for this measurement. We specify clipping voltage as when the THD+N reaches 1%, and the 1% point is reached just above 2V. When repeating this test with the fixed gain set to "1V," the THD+N reached 1% at 1.1V (not shown). Both clipping points occurred when the input level was 1.05V. The distortion in fig.3 lay below the noisefloor, below 1V, and with a 50Hz signal at 2V into 100k ohms (fig.4), the second and third harmonics were the highest in level, at a still very low –87dB and –83dB, respectively. Repeating this test with a 600 ohm load (not shown) both increased the levels of the second and third harmonics and introduced higher-order harmonics in the right channel but not the left. Similarly, the right channel had higher levels of intermodulation products (fig.5, red trace) than the left (blue) when driven with an equal mix of 19 and 20kHz tones at a peak level of 2V into 100k ohms. The higher levels of the products at 28kHz and 29kHz confirm that the analog input is digitized at 48kHz. (Their frequencies are equal to 48–20kHz and 48–19kHz, respectively.)
Fig.3 WiiM Mini, analog input, 2V output setting, THD+noise (%) vs 1kHz output voltage into 100k ohms..
Fig.4 WiiM Mini, analog input, 2V output setting, spectrum of 50Hz sinewave, DC–1kHz, at 2V into 100k ohms (left channel blue, right red; linear frequency scale).
Fig.5 WiiM Mini, analog input, 2V output setting, HF intermodulation spectrum, DC–30kHz, 19+20kHz at 2V into 100k ohms (left channel blue, right red; linear frequency scale)..
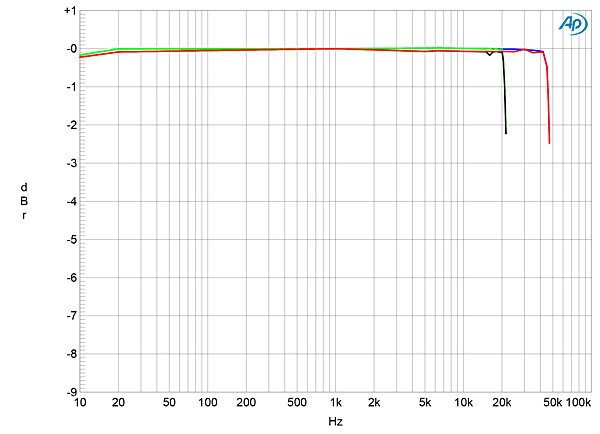
Turning to files stored on my iPad mini 2 and transmitted to the WiiM Mini via Wi-Fi (using the WiiM Home app), the Mini accepted data sampled at rates up to 96kHz. Fig.6 shows the WiiM's frequency response with data sampled at 44.1 and 96kHz. The responses are flat almost to half the sample rate, before quickly rolling off. The output level at the analog output was 1V or 1.985V, depending on the fixed output level setting, and preserved absolute polarity.
Fig.6 WiiM Mini, Wi-Fi data, frequency response at –12dBFS into 100k ohms with data sampled at: 44.1kHz (left channel green, right gray), 96kHz (left blue, right red) (1dB/vertical div.).
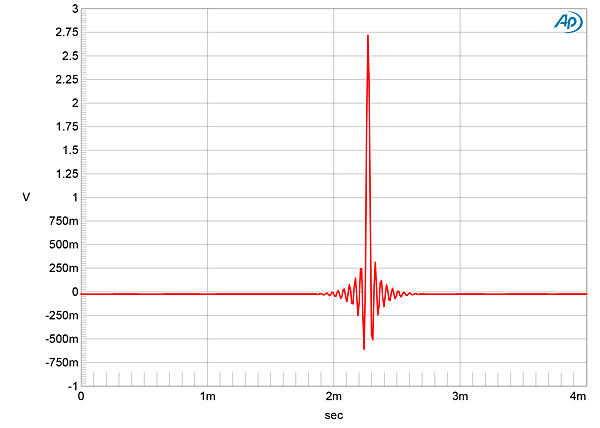
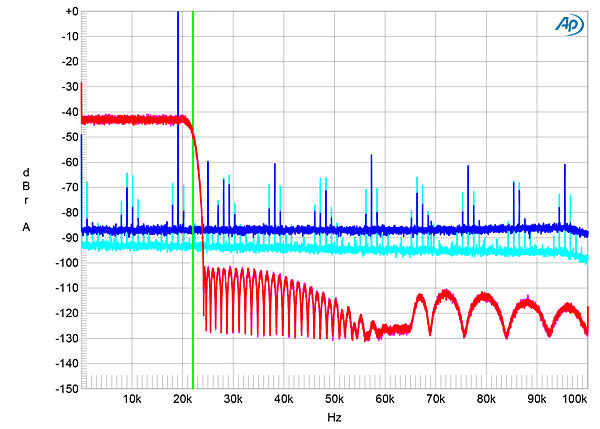
The Mini's impulse response with 44.1kHz data (fig.7) is typical of a linear-phase reconstruction filter, with equal amounts of ringing on both sides of the single full-scale sample. With 24-bit/44.1kHz white-noise data, the filter rolled off rapidly above the audioband (fig.8, magenta and red traces), reaching full stop-band attenuation at 24kHz. However, the ultrasonic noisefloor has an odd, scalloped appearance. The aliased image at 25kHz of a full-scale tone at 19.1kHz (cyan, blue) is only suppressed by 60dB, but more significantly, the noisefloor with this signal is relatively high in level. The harmonics associated with the 19.1kHz tone all lie at around –60dB but have sidebands present at ±1100Hz, as does the fundamental.
Fig.7 WiiM Mini, Wi-Fi data, impulse response (one sample at 0dBFS, 44.1kHz sampling, 4ms time window).
Fig.8 WiiM Mini, Wi-Fi data sampled at 44.1kHz, wideband spectrum of white noise at –4dBFS (left channel red, right magenta) and 19.1kHz tone at 0dBFS (left blue, right cyan) into 100k ohms (20dB/vertical div.).
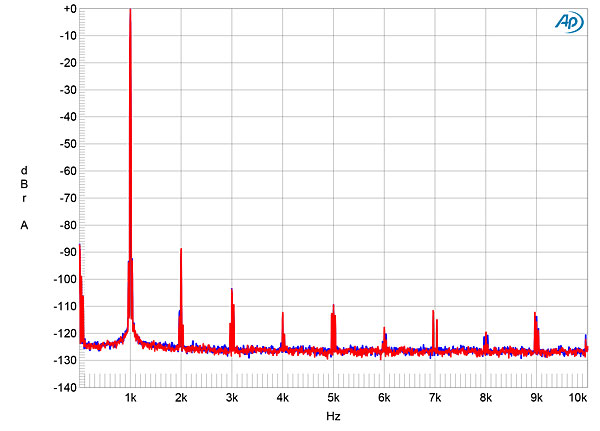
Though an increase in bit depth from 16 to 24 with dithered data representing a 1kHz tone at –90dBFS (fig.9) lowered the level of random noise by almost 30dB—the noisefloor with 16-bit data (cyan and magenta traces) is due to the dither used to encode the signal—the 1kHz signal has disappeared with 24-bit data (blue, red). This confirms that the DAC resolution is limited to 16 bits, as described in the specifications. When I played a full-scale 1kHz tone, the second harmonic was the highest in level in the analog output, at just –90dB (0.003%, fig.10).
Fig.9 WiiM Mini, Wi-Fi data, spectrum with noise and spuriae of dithered 1kHz tone at –90dBFS with: 16-bit data (left channel cyan, right magenta), 24-bit data (left blue, right red) (20dB/vertical div.).
Fig.10 WiiM Mini, 24-bit Wi-Fi data, spectrum of 1kHz sinewave, DC–10kHz, at 2V into 100k ohms (left channel blue, right red; linear frequency scale).
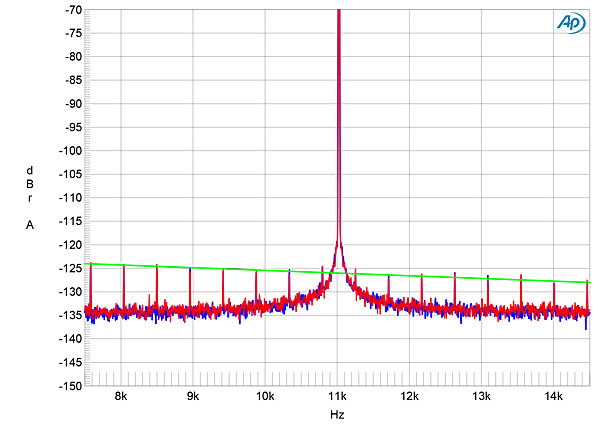
Fig.11 shows the spectrum of the Mini's analog output when it was fed 16-bit J-Test data from my iPhone 11 with the WiiM Home app. The odd-order harmonics of the undithered low-frequency, LSB-level squarewave lie close to the correct levels, indicated by the sloping green line. The central peak that represents the high-level tone at one-quarter the sample rate has some spreading visible at its base, implying the existence of low-frequency random jitter.
Fig.11 WiiM Mini, 16-bit Wi-Fi data, high-resolution jitter spectrum of analog output signal, 11.025kHz at –6dBFS, sampled at 44.1kHz with LSB toggled at 229Hz (left channel blue, right red). Center frequency of trace, 11.025kHz; frequency range, ±3.5kHz.
Fig.12 WiiM Mini, 16-bit, 44.1kHz, J-Test Wi-Fi data, eye pattern of TosLink output (±2.5V vertical scale, 175ns horizontal scale).
I was pleasantly surprised by the measured performance of the WiiM Mini's analog input and output. My experience of other extremely low-priced D/A processors had lowered my expectations, and while the analog output is limited to 16 bits, the only significant issue I found was the higher distortion at high frequencies and into low impedances.—John Atkinson


