
The overall response of the Image 4T, averaged across a 30 degrees horizontal window on the tweeter axis, is shown in fig.4. The narrow suckout between 1kHz and 2kHz can again be seen, but probably of more subjective significance is the shape of the response trend: overall it is quite flat, though with a slight lack of upper-midrange energy. Depending on the nature of the music, this might be heard as a laid-back character in the midrange or as a slight excess of presence-region energy, particularly as the lateral dispersion (fig.5) shows a slight flare in the same region (cursor position). Overall, however, the dispersion is very well-controlled in the horizontal plane. Vertically (fig.6), there is very little change with microphone height, though the interference notch mentioned earlier does tend to fill in on unrealistically low listening axes. 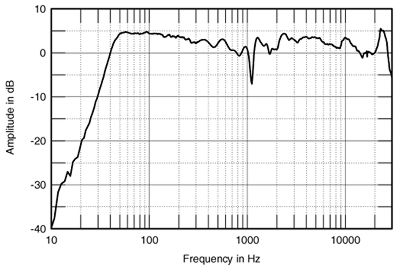 Fig.4 PSB Image 4T, anechoic response on-axis at 50", averaged across 30 degrees horizontal window and corrected for microphone response, with the complex sum of the nearfield woofer and port responses plotted below 300Hz.
 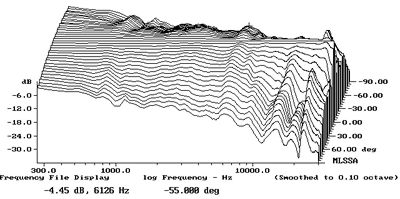 Fig.5 PSB Image 4T, lateral response family at 50", normalized to response on tweeter axis, from back to front: differences in response 90 degrees-5 degrees off-axis, reference response, differences in response 5 degrees-90 degrees off-axis.
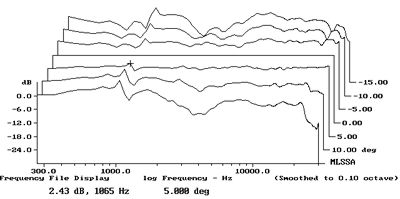 Fig.6 PSB Image 4T, vertical response family at 50", normalized to response on tweeter axis, from back to front: differences in response 15 degrees-5 degrees above reference axis, reference response, differences in response 5 degrees-10 degrees below axis. In the time domain, the PSB's step response (fig.7) reveals that all three drive-units are connected with the same, positive acoustic polarity, with the tweeter step smoothly handing over to the upper woofer's step. However, some mild ringing can be seen overlaying the tail of the woofer step. Though the waterfall plot (fig.8) is generally very clean, it shows that this ringing is associated with some delayed energy at the top of the upper woofer's passband. Perhaps this is the cause of Bob's "powdery" coloration.
 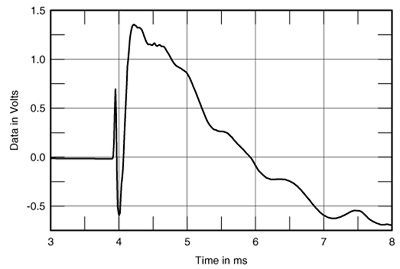 Fig.7 PSB Image 4T, on-axis step response at 50" (5ms time window, 30kHz bandwidth).
 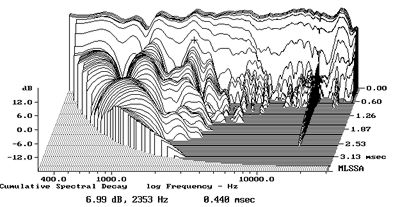 Fig.8 PSB Image 4T, cumulative spectral-decay plot at 50" (0.15ms risetime). All in all, this is excellent measured performance for such an inexpensive loudspeaker.—John Atkinson
Fig.4 PSB Image 4T, anechoic response on-axis at 50", averaged across 30 degrees horizontal window and corrected for microphone response, with the complex sum of the nearfield woofer and port responses plotted below 300Hz. Fig.5 PSB Image 4T, lateral response family at 50", normalized to response on tweeter axis, from back to front: differences in response 90 degrees-5 degrees off-axis, reference response, differences in response 5 degrees-90 degrees off-axis. Fig.6 PSB Image 4T, vertical response family at 50", normalized to response on tweeter axis, from back to front: differences in response 15 degrees-5 degrees above reference axis, reference response, differences in response 5 degrees-10 degrees below axis. In the time domain, the PSB's step response (fig.7) reveals that all three drive-units are connected with the same, positive acoustic polarity, with the tweeter step smoothly handing over to the upper woofer's step. However, some mild ringing can be seen overlaying the tail of the woofer step. Though the waterfall plot (fig.8) is generally very clean, it shows that this ringing is associated with some delayed energy at the top of the upper woofer's passband. Perhaps this is the cause of Bob's "powdery" coloration. Fig.7 PSB Image 4T, on-axis step response at 50" (5ms time window, 30kHz bandwidth). Fig.8 PSB Image 4T, cumulative spectral-decay plot at 50" (0.15ms risetime). All in all, this is excellent measured performance for such an inexpensive loudspeaker.—John Atkinson