Sidebar 2: Measurements
The impedance plot of the Paradigm Studio Monitor (fig.1) shows a rather high average impedance which should be no problem for any amplifier to drive; it only drops below 4 ohms for an octave or so centered at 100Hz, to a minimum of 3 ohms. The cabinet is tuned to a low frequency of approximately 25Hz—the dip in the saddle between the two typical reflex resonant peaks in the bass. The impulse response in fig.3 shows a small amount of high-frequency ringing typical of metal-dome tweeters, but it is well damped. The reflection just after the 4ms mark is probably from the edge of the baffle. The step response (fig.3) indicates that the tweeter and midrange unit are connected in positive acoustic polarity, the woofer in inverted polarity, but the smooth transition between the decay of each unit's step and the start of the next's suggests optimal crossover design.
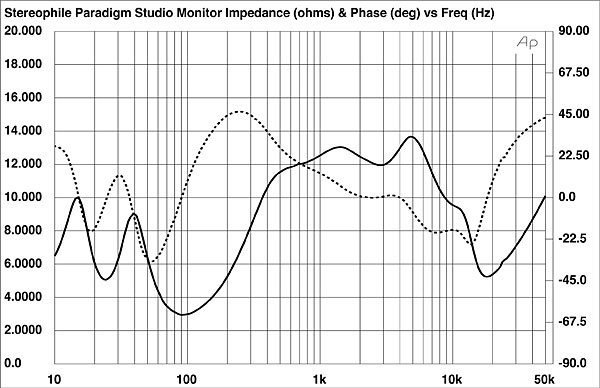
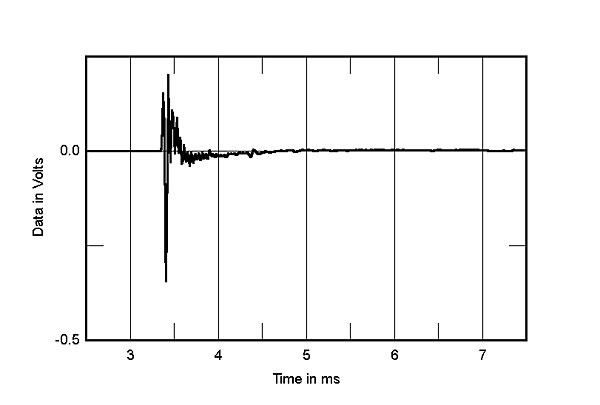
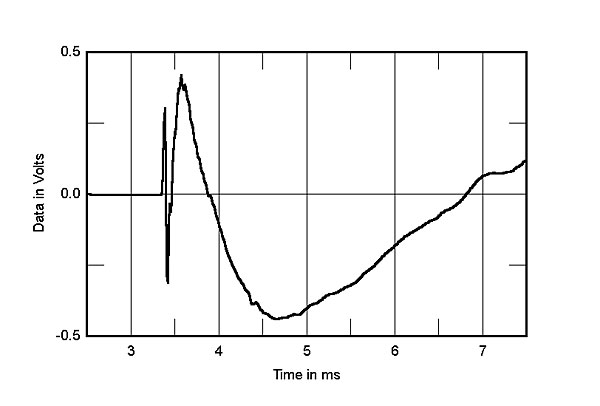
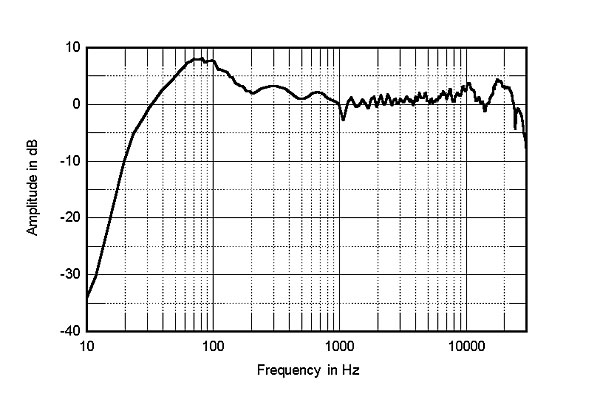
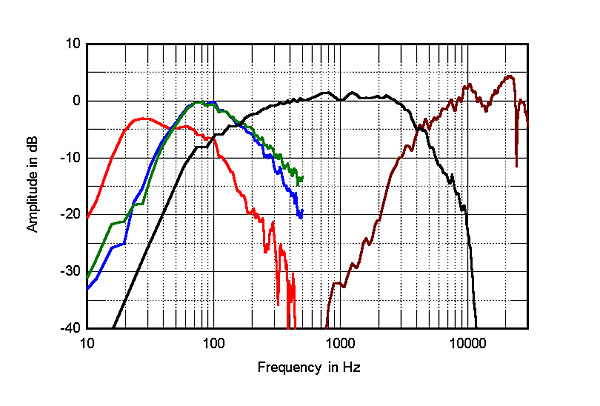
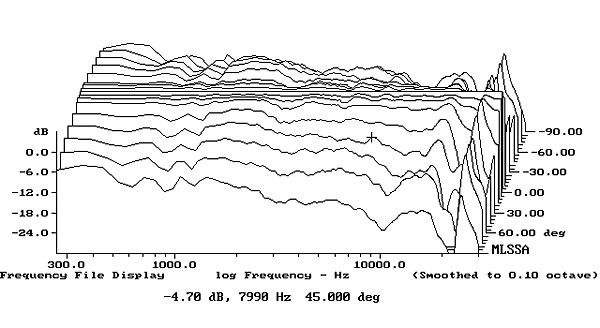
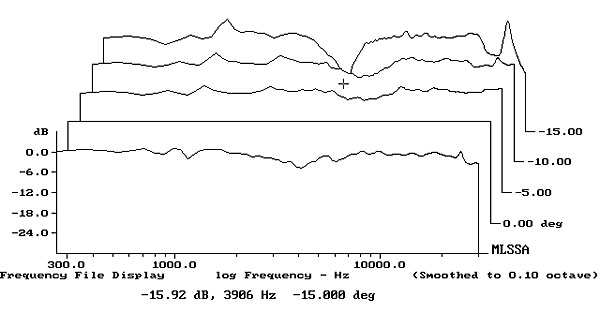
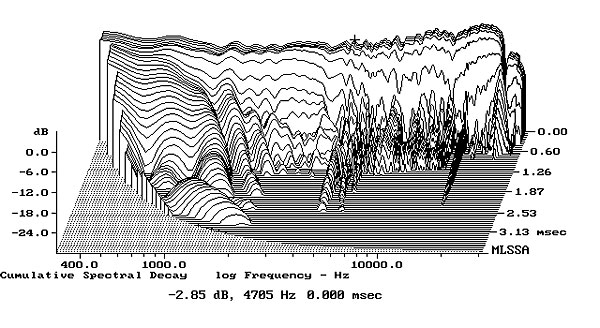 Fig.9 shows the Paradigm Studio Monitor's response on the upper side panel. A possibly significant, isolated resonance is visible at 414Hz, along with further modes in the 300Hz region and some hash, indicative of complex vibration modes, visible higher up in frequency. This was the worst case noted with the Paradigm, though the lowest-frequency mode, at 289Hz, was also strong on the rear panel. Lower down the side panel, what resonances there were dropped significantly in level, though an additional mode appeared at 100Hz.—Thomas J. Norton
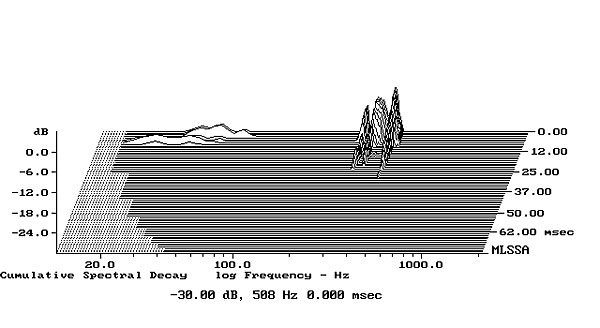
Fig.1 Paradigm Studio Monitor, electrical impedance (solid) and phase (dashed) (2 ohms/vertical div.).
Fig.2 Paradigm Studio Monitor, impulse response on tweeter axis at 45" (5ms time window, 30kHz bandwidth).
Fig.3 Paradigm Studio Monitor, step response on tweeter axis at 45" (5ms time window, 30kHz bandwidth).
The 30° averaged quasi-anechoic response on the midrange-driver axis (fig.4) shows a very smooth result across most of the midrange, a small rise in the 10kHz region, a dip beyond that, then a rise again from 15–20kHz. Though this measurement is valid only down to about 250Hz, the complex sum of the lower-frequency drivers below 250Hz shows a rising response that will only ne due to the nearfield technique. Fig.5 breaks out the response between that of the tweeter alone (brown trace), the midrange alone at 45" above 400Hz and in the nearfield below 350Hz (black trace), the two woofers in the nearfield (the blue and green traces), and the port in the nearfield (red trace). Remember that the splicing of levels for the woofer traces is only approximate with that of the midrange driver. If the actual level of the woofers relative to the midrange as shown in this curve were only a few dB higher, the result would be an audible hump centered at 80Hz—which would go a long way toward explaining the midbass quality noted in the auditions.
Fig.4 Paradigm Studio Monitor, anechoic response on tweeter axis at 45", averaged across 30° horizontal window and corrected for microphone response, with complex sum of nearfield midrange, woofer, and port responses plotted below 200Hz.
Fig.5 Paradigm Studio Monitor, acoustic crossover on tweeter axis at 45", corrected for microphone response, with nearfield midrange (black trace), woofer (green and blue), and port (red) responses plotted below 300Hz.
The horizontal response family in fig.6, normalized to show the differences from the midrange-axis response (which appears therefore as an idealized, flat, on-axis response shown as the top curve), and smoothed to 0.1 octave, shows the changes in response as you move off-axis. There is some peaking off-axis in the high treble between 10kHz and 20kHz, but it is fairly inconsequential. The vertical response family in fig.7 indicates that the Paradigms should not be listened to much above the tweeter axis (the middle plot); if you can see the top of the cabinet, you're definitely too high. That should not be a problem with these relatively tall loudspeakers.
Fig.6 Paradigm Studio Monitor, lateral response family at 45", normalized to response on tweeter axis, from back to front: differences in response 90–15° off axis, reference response, differences in response 15–90° off axis.
Fig.7 Paradigm Studio Monitor, vertical response family at 45", normalized to response on tweeter axis, from back to front: differences in response 15–5° above axis, reference response, differences in response 5° below axis.
The cumulative spectral-decay or waterfall plot (fig.8) shows a clean result with no serious aberrations. A minor resonance seen at about 4300Hz did not relate to any specific sonic problem.
Fig.8 Paradigm Studio Monitor, cumulative spectral-decay plot on tweeter axis at 45" (0.15ms risetime).
Finally, as a loudspeaker system is a vibration generator, vibration measurements were made by applying the signal from our MLSSA test set to the loudspeaker in the normal fashion, but by reading the loudspeaker enclosure's output with the accelerometer rather than measuring the system's acoustical output with a microphone. An FFT of the data was performed in the usual fashion, and a spectral-decay curve plotted out. Readings were taken at several points on the cabinet walls; the most interesting result is shown.
Fig.9 Paradigm Studio Monitor, cumulative spectral-decay plot calculated from output of accelerometer fastened to center of upper side panel (MLS driving voltage to speaker, 7.55V; measurement bandwidth, 2kHz).