| Columns Retired Columns & Blogs |
Manley Laboratories Stingray integrated amplifier Measurements
Sidebar 3: Measurements
Unless otherwise noted, all measurements were made at level settings that resulted in a 1W output with an input of 100mV. This was approximately 1:30 on the Manley Stingray's volume control, at which position the voltage gain into 8 ohms was 29dB. The Stingray's gain at the maximum setting of the volume control was 39.5B.
After one hour of operation at 1/3 power the Stingray was running no hotter than is typical of tube amplifiers. The Manley's input impedance measured a comfortably high 47.2k ohms. The output impedance, however, was also high, ranging from a maximum of 3.87 ohms at 20Hz to a minimum of 2.83 ohms at 20kHz—values guaranteed to affect the amplifier's frequency response through real loudspeakers. DC offset at the main outputs measured a negligible 0.3mV in the left channel, 0.1mV in the right. The Signal/Noise Ratio (referenced to 1W into 8 ohms, left channel, all values rounded to the nearest dB) measured a good 73dB from 22Hz to 22kHz, 69dB from 10Hz to 500kHz, both unweighted, and 78dB A-weighted. The A-weighted value dipped intermittently to 70dB, this most likely due to a slightly noisy tube.
The Stingray is noninverting, a positive-going input resulting in a positive-going output. Its volume-control tracking is fair, with a left/right output deviation of up to 1dB, depending on the setting. The volume control's detents are fairly coarse, particularly from 12:00 down. While the maximum change measured in the plus direction was 1.7dB, two steps in the minus direction resulted in changes of approximately 5dB each. It is possible, however, to position the control between detents.
Fig.1 shows the Stingray's frequency response. (Note the 1dB/division scale.) The response into a resistive load shows a slight downtilt at low frequencies. The uneven response into our simulated loudspeaker load, however, is the result of the amplifier's high output impedance. Similar deviations will always be present in actual use, though varying slightly depending on the impedance of the speaker used. These changes should be clearly audible, and will make the amplifier's sound highly speaker-dependent—a characteristic of most tube amps.
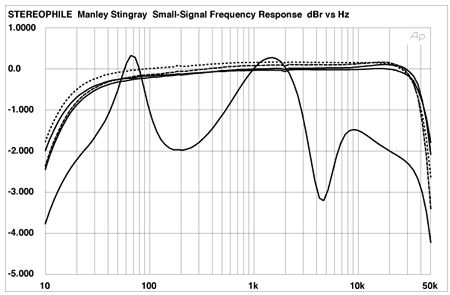
Fig.1 Manley Stingray, frequency response at (from top to bottom at 1kHz): 2.828V into 8 ohms, 4 ohms, and simulated loudspeaker load, (1dB/vertical div., right channel dashed).
Fig.2 indicates the Manley's output with a 10kHz squarewave input. The risetime is fair, but there is a noticeable overshoot and some damped, ultrasonic ringing. The overshoot is also very evident in the 1kHz squarewave (not shown), though the ringing is not.
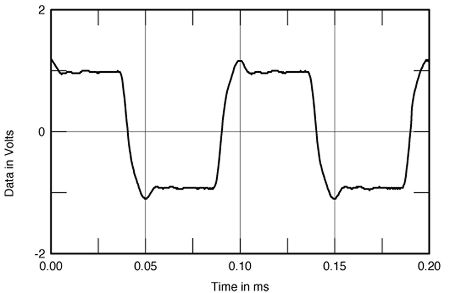
Fig.2 Manley Stingray, small-signal 10kHz squarewave into 8 ohms.
Fig.3 shows the Stingray's channel separation: a fair result at best, with the crosstalk in one direction noticeably worse than the other. However, in neither direction is the crosstalk likely to result in noticeable audio degradation.
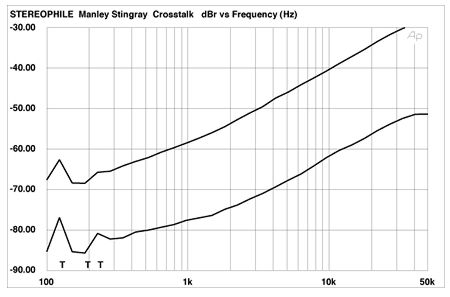
Fig.3 Manley Stingray, channel separation vs frequency, from top to bottom: L-R, R-L (10dB/vertical div., right channel dashed).
The THD+noise percentage vs frequency results shown in fig.4 are respectable for a tube amplifier, though the right channel's low-frequency distortion could be lower. (The bias for each tube was within 10mV of the recommended 250mV reading for these measurements.) It's clear, however, that the Stingray is not very happy with loads below 4 ohms. Fig.5 shows the waveform of the amplifier's THD+noise at 2W into a 4 ohm load. The second harmonic predominates.

Fig.4 Manley Stingray, THD+noise (%) vs frequency at (from top to bottom at 2kHz): 4W into 2 ohms, 2W into 4 ohms, 1W into 8 ohms, and 2.83V into simulated loudspeaker load (right channel dashed).
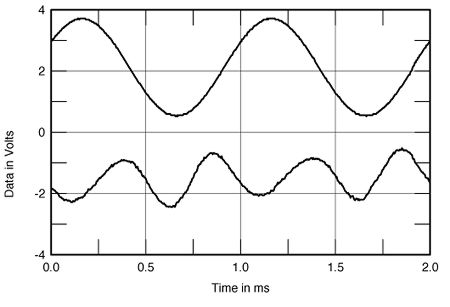
Fig.5 Manley Stingray, 1kHz waveform at 2W into 4 ohms (top), distortion and noise waveform with fundamental notched out (bottom, not to scale).
Fig.6 shows the Manley's spectral response with a 50Hz input at an output of 33.5W into an 8 ohm load. The second harmonic (100Hz) is just below -40dB (1%), the third at -44dB (just under 0.7%). For reference, fig.7 shows a similar spectrum taken with a 1kHz tone driven at 33.5W into 8 ohms. The second harmonic has dropped to a more respectable -59dB (just above 0.1%) with the third harmonic now highest in level, at -56dB (0.15%). Clearly the amplifier is less linear at low frequencies and high levels, but if you read EveAnna Manley's comments in the main text of this review, it seems that this was a deliberate design choice.
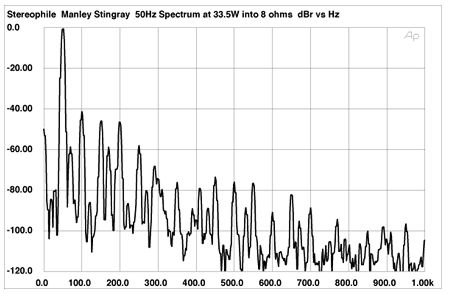
Fig.6 Manley Stingray, spectrum of 50Hz sinewave, DC-1kHz, at 33.5W into 8 ohms (linear frequency scale).
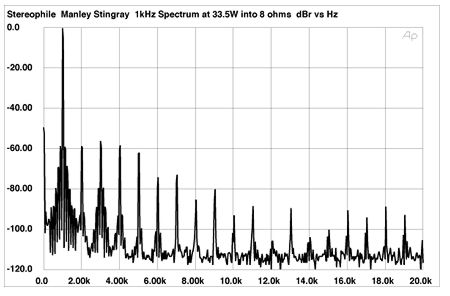
Fig.7 Manley Stingray, spectrum of 1kHz sinewave, DC-20kHz, at 33.5W into 8 ohms (linear frequency scale).
The spectrum shown in fig.8 reveals the intermodulation in the output with a combined 19+20kHz signal being delivered at 19.7W into 4 ohms (about as high as this amplifier will deliver into this load before visible clipping of the waveform). The difference artifact at 1kHz lies at -52.9dB (about 0.25%), the 18kHz component is -35.7dB (about 1.7%). This intermodulation is just marginally lower at most frequencies at the same power into 8 ohms (not shown), but higher at 1kHz (about 0.45%). The results of figs.6, 7, and 8 may appear uninspiring, but they are not out of the ordinary for tube amplifiers, which traditionally do relatively poorly on these spectral analyses.
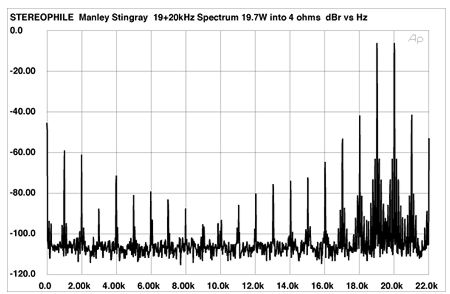
Fig.8 Manley Stingray, HF intermodulation spectrum, DC-22kHz, 19+20kHz at 19.7W into 4 ohms (linear frequency scale).
Fig.9 shows the way in which the Stingray's THD+noise at 1kHz varies with output power with one channel continuously driven into 8, 4, and 2 ohm loads. The discrete clipping measurements are shown, to the nearest watt, in Table 1. Note, too, that the clipping levels are given at 3% THD+noise rather than the 1% we usually specify. Note that the Stingray doesn't quite meet its specified power into either 8 or 4 ohms. However, an amplifier like this with a relatively undersized power supply will deliver more power with a music signal than with the continuous test tones used to derive fig,9 and Table 1. Accordingly, fig.10 shows the Manley's THD percentage plotted against power delivery for a low duty-cycle 1kHz toneburst (10 cycles on, 400 cycles off).
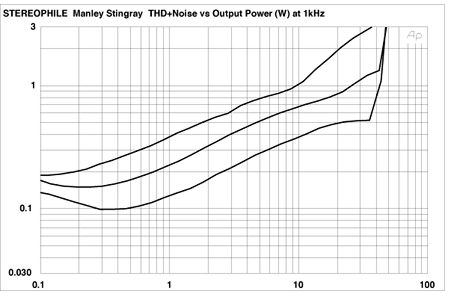
Fig.9 Manley Stingray, distortion (%) vs continuous output power into (from bottom to top) 8 ohms, 4 ohms, and 2 ohms.
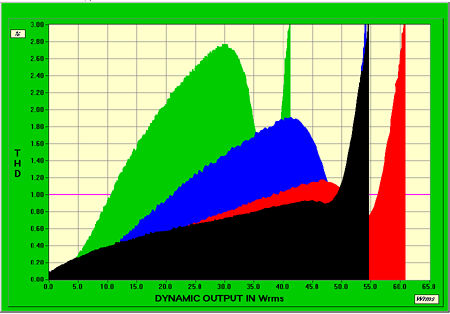
Fig.10 Manley Stingray, distortion (%) vs 1kHz burst output power into 8 ohms (black trace), 4 ohms (red), 2 ohms (blue), and 1 ohm (green).
Table 1 Manley Stingray: Discrete Clipping
| (3% THD+noise at 1kHz) | |||
| Both Channels Driven | One ChannelDriven | ||
| Load | W (dBW) | W (dBW) | |
| Load | (L) | (R) | (L) |
| 8 ohms | 45.9 (16.6) | 46.6 (16.7) | 46.6 (16.7) |
| (line V) | 116V | 116V | 116V |
| 4 ohms | 45.5 (13.6) | 46 (13.6) | 47.5 (13.8) |
| (line V) | 116V | 116V | 116V |
| 2 ohms | 38 (9.8) | ||
| (line V) | 116V | ||
Under these conditions, the Stingray delivers 54.6W into 8 ohms (black trace) and 60.8W into 4 ohms (red trace) for 3% THD+noise. The distortion rises in a relatively linear manner with output power. But into 2 ohms (blue) and 1 ohm (green), the power delivery drops and the distortion rises dramatically. Speakers with impedances that drop below 3-4 ohms or have high electrical phase angles should best be avoided. For a 1% THD figure (horizontal magenta line), the maximum current delivery was about the same into all loads, at around 3.5A, which is actually quite respectable considering the Stingray's physically small output transformers.
Except for those areas in which tube amplifiers often perform poorly on the test bench, the Manley Stingray turns in a respectable if unremarkable set of numbers. Just be aware that your choice of loudspeakers will be even more important with the Stingray than with other amplifiers—not because the loudspeaker may be difficult to drive per se (although I repeat that I'd avoid very low-impedance speakers with the Manley), but because the Stingray's high output impedance will interact with the loudspeaker's impedance to create audible deviations in frequency response.—Thomas J. Norton
- Log in or register to post comments

