| Columns Retired Columns & Blogs |
Linn Klimax 500 Solo monoblock power amplifier Measurements part 2
The small-signal THD+noise vs frequency curves are plotted in fig.3. The results show increasing levels of distortion with lower load impedances—another common result. The distortion from the balanced input is, in all cases, lower than that from the unbalanced connection, but to no pronounced degree.

Fig.3 Linn Klimax 500 Solo, THD+noise (%) vs frequency at (from top to bottom at 2kHz): 4W into 2 ohms, 2W into 4 ohms, 1W into 8 ohms, and 2.83V into simulated loudspeaker load (balanced curves are each slightly lower than unbalanced).
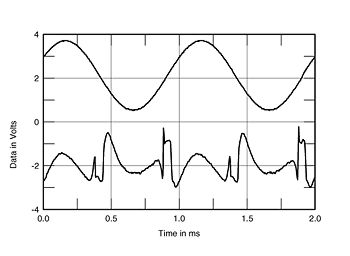
The waveform of the distortion at 2W into 4 ohms is shown in fig.4. While there is a clear second-order component, significant amounts of higher-order distortion are visible, though the actual distortion levels are quite low. The distortion waveforms are very similar at 1W into 8 ohms and 4W into 2 ohms (neither shown).

Fig.4 Linn Klimax 500 Solo, 1kHz waveform at 2W into 4 ohms (top), distortion and noise waveform with fundamental notched out (bottom, not to scale).
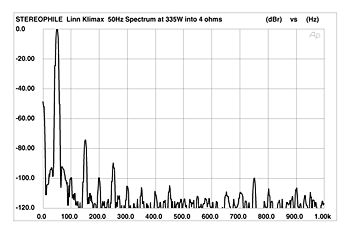
Fig.5 shows the Klimax's output spectrum at 335W into a 4 ohm load when driven by a 50Hz signal. The distortion products are generally very low: -74.4dB at the third harmonic of 150Hz (about 0.02%), and -89.6dB (just over 0.003%) at the fifth, 250Hz.

Fig.5 Linn Klimax 500 Solo, spectrum of 50Hz sinewave, DC-1kHz, at 335W into 4 ohms (linear frequency scale).
- Log in or register to post comments


