Sidebar 2: Measurements
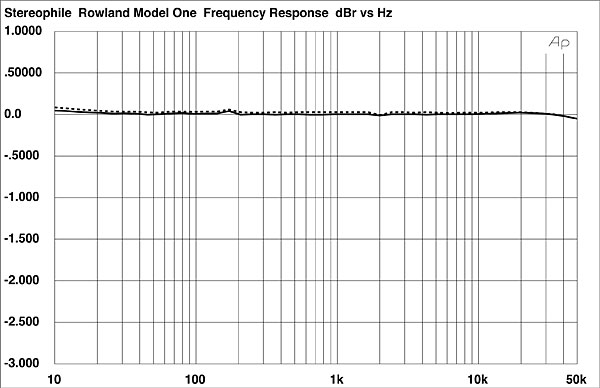
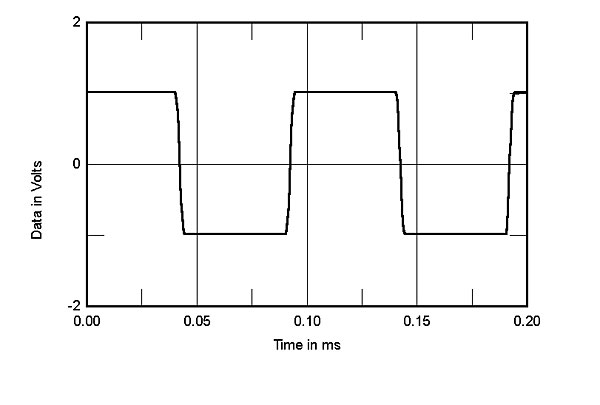
As can be seen from fig.1, the Rowland exhibits a virtually ruler-flat frequency-response curve. The 10kHz squarewave (fig.2) indicates a fast rise-time, with no significant rounding of the leading edges. Polarity of the Rowland was non-inverting, and input impedance at 1kHz was 20.8k ohms, 95k ohms, and 750 ohms at the 20k ohm, 100k ohm, and 600 ohm input settings respectively. It required 142.4mV to give an output of 1W into 8 ohms, a gain of 26dB. Unweighted noise was 75.3dB below 1W into 8 ohms. Channel separation was better than 105dB below 1.5kHz (actually better than 110dB across much of that range), decreasing linearly to 92dB at 20kHz.
 With both channels driven, the Model 1's output power was 76W (18.8dBW) into 8 ohms and 126.8 (18dBW) into 4 ohms (both for the right channel—the left was marginally higher). The power-supply fuses blew (twice) at 190W into 2 ohms, before clipping could be reached.
DC offset in the Rowland was 2mV in the left channel, 3mV in the right. It operated quite warm to the touch following its 1-hour, 1/3-power preconditioning, but not hot.
Finally, I measured both the frequency response and the low-power THD+noise vs frequency for the Rowland set for a 600 ohm load. Except for the input impedance measurements, where all three settings were checked, the above measurements were made into the amplifier's 20k ohm setting. The curves have not been shown because they did not differ at all from the equivalent curves for the 20k ohm setting.
Attempting to relate the outstanding lab-test results of the Rowland Model 1 to its equally rewarding sound was a hopeless task. However, the measurements in this case merely indicated that this is, from any objective measure, a solidly designed amplifier.—Thomas J. Norton
With both channels driven, the Model 1's output power was 76W (18.8dBW) into 8 ohms and 126.8 (18dBW) into 4 ohms (both for the right channel—the left was marginally higher). The power-supply fuses blew (twice) at 190W into 2 ohms, before clipping could be reached.
DC offset in the Rowland was 2mV in the left channel, 3mV in the right. It operated quite warm to the touch following its 1-hour, 1/3-power preconditioning, but not hot.
Finally, I measured both the frequency response and the low-power THD+noise vs frequency for the Rowland set for a 600 ohm load. Except for the input impedance measurements, where all three settings were checked, the above measurements were made into the amplifier's 20k ohm setting. The curves have not been shown because they did not differ at all from the equivalent curves for the 20k ohm setting.
Attempting to relate the outstanding lab-test results of the Rowland Model 1 to its equally rewarding sound was a hopeless task. However, the measurements in this case merely indicated that this is, from any objective measure, a solidly designed amplifier.—Thomas J. Norton
Fig.1 Rowland Model 1, frequency response at 1W into 8 ohms (right channel dashed, 0.5dB/vertical div.).
Fig.2 Rowland Model 1, small-signal 10kHz squarewave into 8 ohms.
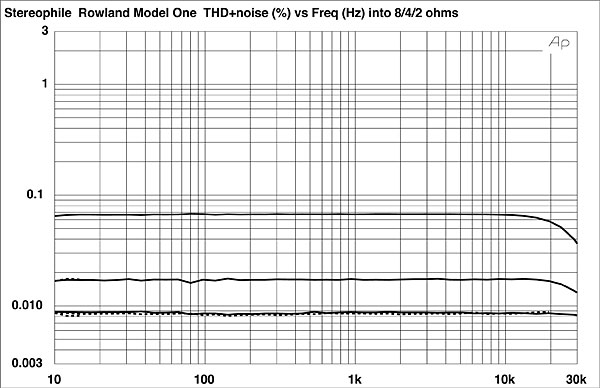
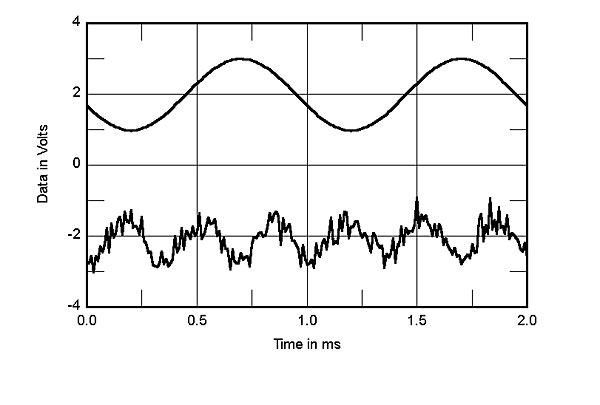
The output impedance of the Model 1 was uniformly low, ranging from 0.056 to 0.065 ohms across the audible range. Distortion at low power is shown in fig.3, which plots THD+noise against frequency at 2.83V into 8, 4, and 2 ohms (bottom, middle, and top traces, respectively). The consistently low distortion increases as the impedance drops—not unexpectedly. What is interesting is the slight reduction in distortion into both 4 and 2 ohms at higher frequencies, which is unusual, suggesting perhaps that the amplifier's VHF bandwidth narrows a little with increasing output current. The waveform of the distortion in fig.4 (showing a 1kHz, 2W output into a 4 ohm load) indicates a predominantly third-harmonic characteristic overlaid with noise. The equivalent waveform for a 1kHz, 1W output into 8 ohms (not shown) was dominated by noise.
Fig.3 Rowland Model 1, THD+noise vs frequency at (from top to bottom at 10kHz): 4W into 2 ohms, 2W into 4 ohms, 1W into 8 ohms.
Fig.4 Rowland Model 1, 1kHz waveform at 2W into 4 ohms (top); distortion and noise waveform with fundamental notched out (bottom, not to scale).
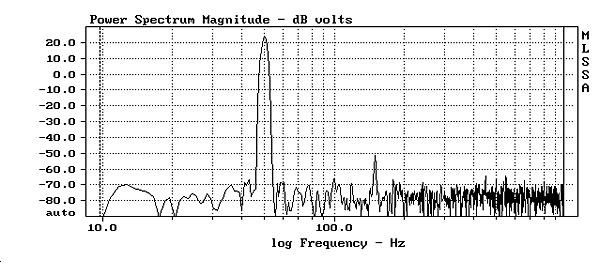
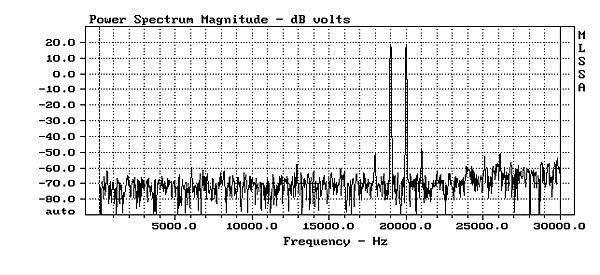
Fig.5 shows the spectrum from a 50Hz sinewave driven at 80W into 4 ohms. The second harmonic is negligible; the third harmonic is stronger (as expected from fig.4) but still down 75.8dB. Fig.6 shows the high-frequency IM spectrum with 19 and 20kHz tones driven at 80W into 4 ohms. The 1kHz product is down 83.5dB; well under 0.001%. A similar measurement for 40W into 8 ohms is not shown since it was, if anything, slightly better at –85.3dB. (These figures are at the residual level in the test signal, suggesting that the amplifier doesn't add anything—compare these results with those JA found for some of the less-expensive amplifiers CG reviewed elsewhere in this issue.)
Fig.5 Rowland Model 1, spectrum of 50Hz sinewave, DC-1kHz, at 67W into 4 ohms (linear frequency scale).
Fig.6 Rowland Model 1, HF intermodulation spectrum, DC-22kHz, 19+20kHz at 48V peak into 8 ohms (linear frequency scale).
Fig.7 indicates the THD vs power for 8, 4, and 2 ohms at 1kHz, one channel driven (bottom, middle, and top curves respectively; line voltage of 113V). The maximum output power at 1% THD was 84W (19.2dBW) into 8 ohms, 140W (18.5dBW) into 4 ohms, and 220W (17.4dBW) into 2 ohms. These figures all lie well above the "knee" of the distortion curve. I consider the "knee" of this curve, when well defined and followed by a rapidly increasing distortion above it, to indicate the highest practical useful power output of an amplifier. In the case of the Model 1, the knee falls at 67W (8 ohms), 130W (4 ohms), and 215W (2 ohms). In the latter two cases, I choose as the knee the break-point before the steepest slope of the distortion curve.
Fig.7 Rowland Model 1, distortion (%) vs output power into (from bottom to top at 40W): 8 ohms, 4 ohms, and 2 ohms.


