Sidebar 3: Measurements
As with all amplifiers that use a switching output stage, examining the Halcro Logic MC20's performance on the test bench was complicated by the presence of RF energy in its output. Unless this energy is filtered, you can never be sure that you're not actually measuring the interaction between the RF content and the test gear instead of the absolute performance of the amplifier under test. (For a discussion of this subject, see my "Measurements" sidebar accompanying Robert Deutsch's review of the PS Audio GCC-100 amplifier in January.)
Fig.1, for example, shows the waveform of a small-signal 10kHz squarewave as reproduced by the MC20. The risetime appears to be relatively long, but more important, the wave is obscured by a large UHF component with an approximate frequency of 500kHz. This can also be seen in the Halcro's reproduction of a 1kHz squarewave (fig.2). The frequency of the UHF content appears to be lower in this graph, but this is because the digital 'scope lacks an input low-pass filter and is therefore showing an aliased product. Switching into circuit a sixth-order low-pass filter set to 30kHz eliminated the switching noise, revealing a degree of overshoot and damped ringing (fig.3).
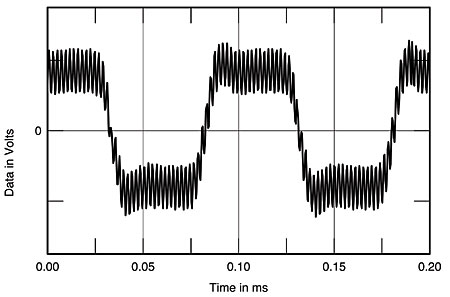 Fig.1 Halcro Logic MC20, small-signal 10kHz squarewave into 8 ohms.
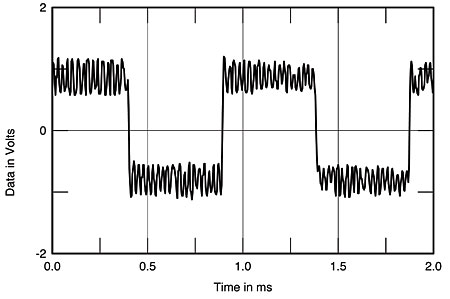 Fig.2 Halcro Logic MC20, small-signal 1kHz squarewave into 8 ohms.
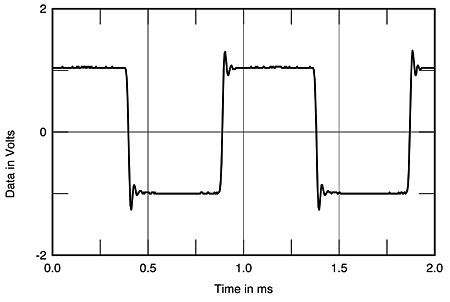 Fig.3 Halcro Logic MC20, small-signal 1kHz squarewave into 8 ohms with sixth-order low-pass filter at 30kHz.
A switch-mode amplifier must have a passive low-pass filter between its output stage and the speaker terminals. The tuning of this filter can be critical, as a mismatch can lead to an ultrasonic response peak. When I measured the MC20's frequency response, I therefore examined its behavior into 32 and 16 ohms as well as into the more usual loads of 8, 4, and 2 ohms (fig.4). The MC20 does roll off above the audioband, but, as can be seen in fig.4, the rolloff starts earlier into the lower impedances, with the response into 2 ohms being 3dB down just above 20kHz. Into 8 ohms, the response is –3dB at a more reasonable 55kHz, while into 32 ohms there is the beginning of a peak developing at 70kHz, this correlating with the damped overshoot seen in fig.3.
Fig.3 Halcro Logic MC20, small-signal 1kHz squarewave into 8 ohms with sixth-order low-pass filter at 30kHz.
A switch-mode amplifier must have a passive low-pass filter between its output stage and the speaker terminals. The tuning of this filter can be critical, as a mismatch can lead to an ultrasonic response peak. When I measured the MC20's frequency response, I therefore examined its behavior into 32 and 16 ohms as well as into the more usual loads of 8, 4, and 2 ohms (fig.4). The MC20 does roll off above the audioband, but, as can be seen in fig.4, the rolloff starts earlier into the lower impedances, with the response into 2 ohms being 3dB down just above 20kHz. Into 8 ohms, the response is –3dB at a more reasonable 55kHz, while into 32 ohms there is the beginning of a peak developing at 70kHz, this correlating with the damped overshoot seen in fig.3.
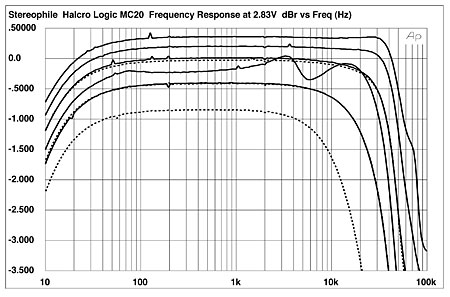 Fig.4 Halcro Logic MC20, frequency response at 2.83V into (from top to bottom at 2kHz): 32 ohms, 16 ohms, simulated loudspeaker load, 8, 4, 2 ohms (0.5dB/vertical div., right channel dashed).
Fig.4 also shows the variation of response with our standard simulated speaker load, which is moderate at ±0.2dB, implying an output impedance only a little higher than is usual for a solid-state design, despite the presence of the MC20's output filter. I measured a value of 0.3 ohm at midrange and bass frequencies, this rising slightly, to 0.55 ohm, at 20kHz. The amplifier's unbalanced input impedance was slightly but usefully more than specified, at 13k ohms through the low treble, but it did drop to 9875 ohms at 20kHz. The balanced figure was lower than specified, at 14k ohms. The MC20 inverted signal polarity from both sets of inputs.
Measuring channel separation was complicated by the presence of ultrasonic noise. However, using the external low-pass filter, I measured midband figures approaching 100dB, which is excellent. Similarly for signal/noise measurements, I had to use the low-pass filter, which gave an audioband figure of 91.7dB ref. 2.83V into 8 ohms. Without the filter, this degraded to 58dB, due to leakthrough of the noise.
I couldn't use the active low-pass filter for high-power testing. When I plotted the percentage of THD+noise in the amplifier's output against power, therefore, the presence of the unfiltered ultrasonic noise interfered with the Audio Precision System One's autoranging, resulting in some broken traces at lower powers in fig.5. Also because of this noise, the THD+noise level shown below clipping is exaggerated. The clipping powers in this graph are 290W into 8 ohms (24.6dBW) and 540W into 4 ohms (24.3dBW), the latter significantly greater than the Halcro's 400W (23dBW) specification. The amplifier shut down above this level into 4 ohms; into 2 ohms, it went into protection at 183W (16.6dBW).
Fig.4 Halcro Logic MC20, frequency response at 2.83V into (from top to bottom at 2kHz): 32 ohms, 16 ohms, simulated loudspeaker load, 8, 4, 2 ohms (0.5dB/vertical div., right channel dashed).
Fig.4 also shows the variation of response with our standard simulated speaker load, which is moderate at ±0.2dB, implying an output impedance only a little higher than is usual for a solid-state design, despite the presence of the MC20's output filter. I measured a value of 0.3 ohm at midrange and bass frequencies, this rising slightly, to 0.55 ohm, at 20kHz. The amplifier's unbalanced input impedance was slightly but usefully more than specified, at 13k ohms through the low treble, but it did drop to 9875 ohms at 20kHz. The balanced figure was lower than specified, at 14k ohms. The MC20 inverted signal polarity from both sets of inputs.
Measuring channel separation was complicated by the presence of ultrasonic noise. However, using the external low-pass filter, I measured midband figures approaching 100dB, which is excellent. Similarly for signal/noise measurements, I had to use the low-pass filter, which gave an audioband figure of 91.7dB ref. 2.83V into 8 ohms. Without the filter, this degraded to 58dB, due to leakthrough of the noise.
I couldn't use the active low-pass filter for high-power testing. When I plotted the percentage of THD+noise in the amplifier's output against power, therefore, the presence of the unfiltered ultrasonic noise interfered with the Audio Precision System One's autoranging, resulting in some broken traces at lower powers in fig.5. Also because of this noise, the THD+noise level shown below clipping is exaggerated. The clipping powers in this graph are 290W into 8 ohms (24.6dBW) and 540W into 4 ohms (24.3dBW), the latter significantly greater than the Halcro's 400W (23dBW) specification. The amplifier shut down above this level into 4 ohms; into 2 ohms, it went into protection at 183W (16.6dBW).
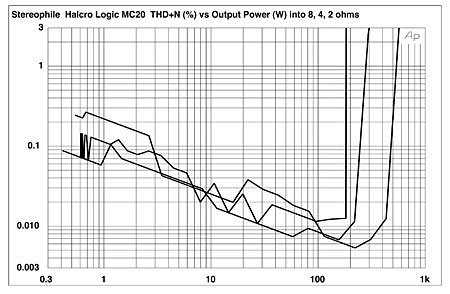 Fig.5 Halcro Logic MC20, distortion (%)vs 1kHz continuous output power into (from bottom to top at 100W): 8, 4, 2 ohms.
For reasons already explained, I used the 30kHz active low-pass filter to measure how THD+N changed with frequency, which is why fig.6 is plotted only up to 10kHz, the highest frequency at which the third harmonic will be allowed through by this filter. At most frequencies, there is no difference in the THD+N percentage taken into loads ranging from 2 to 8 ohms. There is a peculiar change centered on 90Hz, however, where the THD+N increases into lower impedances. I have no idea what this means, but as the level of spuriae is still below 0.04%, I don't think it significant.
Fig.5 Halcro Logic MC20, distortion (%)vs 1kHz continuous output power into (from bottom to top at 100W): 8, 4, 2 ohms.
For reasons already explained, I used the 30kHz active low-pass filter to measure how THD+N changed with frequency, which is why fig.6 is plotted only up to 10kHz, the highest frequency at which the third harmonic will be allowed through by this filter. At most frequencies, there is no difference in the THD+N percentage taken into loads ranging from 2 to 8 ohms. There is a peculiar change centered on 90Hz, however, where the THD+N increases into lower impedances. I have no idea what this means, but as the level of spuriae is still below 0.04%, I don't think it significant.
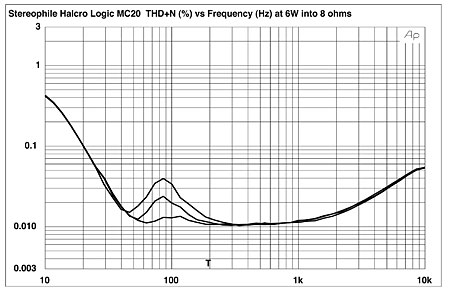 Fig.6 Halcro Logic MC20, THD+N (%)vs frequency at 4.7V into (from bottom to top at 100Hz): 8, 4, 2 ohms.
Without the low-pass filter, it was fruitless to look at the waveform of the spuriae to assess the dominant harmonic; all you can see is ultrasonic noise (fig.7). With the filter, the dominant harmonic, at least at midrange frequencies, is the subjectively benign third (fig.8). But at low frequencies, the increase in THD seen in fig.6 appears to be due to the appearance of the second harmonic (fig.9). Intermodulation distortion was also very low in level (fig.10), though the need to use the active low-pass filter for this measurement meant that I could not do this test at high output powers.
Fig.6 Halcro Logic MC20, THD+N (%)vs frequency at 4.7V into (from bottom to top at 100Hz): 8, 4, 2 ohms.
Without the low-pass filter, it was fruitless to look at the waveform of the spuriae to assess the dominant harmonic; all you can see is ultrasonic noise (fig.7). With the filter, the dominant harmonic, at least at midrange frequencies, is the subjectively benign third (fig.8). But at low frequencies, the increase in THD seen in fig.6 appears to be due to the appearance of the second harmonic (fig.9). Intermodulation distortion was also very low in level (fig.10), though the need to use the active low-pass filter for this measurement meant that I could not do this test at high output powers.
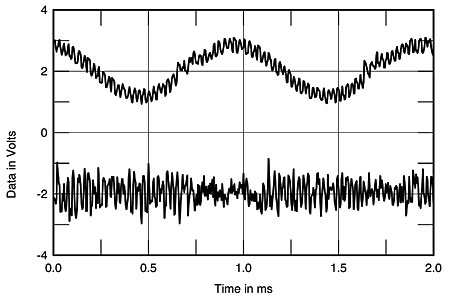 Fig.7 Halcro Logic MC20, 1kHz waveform at 6W into 8 ohms (top), 0.2% THD+N; distortion and noise waveform with fundamental notched out (bottom, not to scale).
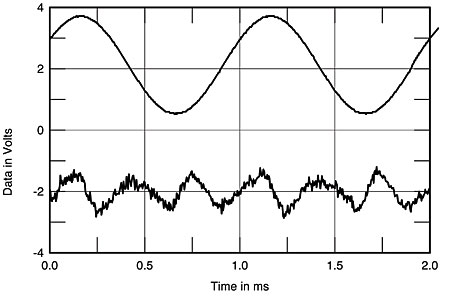 Fig.8 Halcro Logic MC20, 1kHz waveform at 6W into 8 ohms (top), 0.0116% THD+N, with sixth-order low-pass filter at 30kHz; distortion and noise waveform with fundamental notched out (bottom, not to scale).
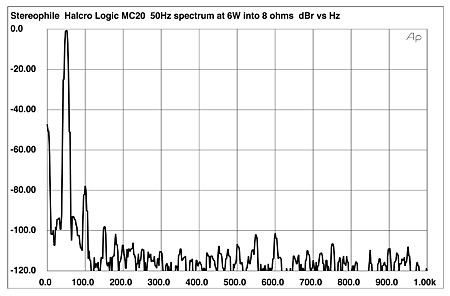 Fig.9 Halcro Logic MC20, spectrum of 50Hz sinewave, DC–1kHz, at 6W into 8 ohms, with sixth-order low-pass filter at 30kHz (linear frequency scale).
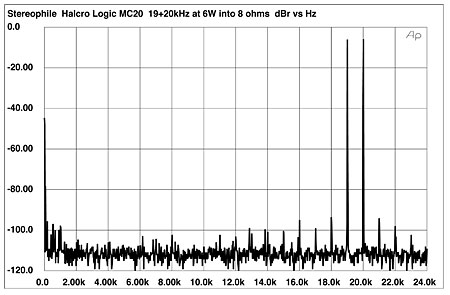 Fig.10 Halcro Logic MC20, HF intermodulation spectrum, DC–24kHz, 19+20kHz at 12W peak into 8 ohms (linear frequency scale).
The presence of the ultrasonic switching noise aside, the Halcro Logic MC20 offers good measured performance. It will work best with speakers having impedances between 4 and 16 ohms.—John Atkinson
Fig.10 Halcro Logic MC20, HF intermodulation spectrum, DC–24kHz, 19+20kHz at 12W peak into 8 ohms (linear frequency scale).
The presence of the ultrasonic switching noise aside, the Halcro Logic MC20 offers good measured performance. It will work best with speakers having impedances between 4 and 16 ohms.—John Atkinson
Fig.1 Halcro Logic MC20, small-signal 10kHz squarewave into 8 ohms.
Fig.2 Halcro Logic MC20, small-signal 1kHz squarewave into 8 ohms.
Fig.3 Halcro Logic MC20, small-signal 1kHz squarewave into 8 ohms with sixth-order low-pass filter at 30kHz.
A switch-mode amplifier must have a passive low-pass filter between its output stage and the speaker terminals. The tuning of this filter can be critical, as a mismatch can lead to an ultrasonic response peak. When I measured the MC20's frequency response, I therefore examined its behavior into 32 and 16 ohms as well as into the more usual loads of 8, 4, and 2 ohms (fig.4). The MC20 does roll off above the audioband, but, as can be seen in fig.4, the rolloff starts earlier into the lower impedances, with the response into 2 ohms being 3dB down just above 20kHz. Into 8 ohms, the response is –3dB at a more reasonable 55kHz, while into 32 ohms there is the beginning of a peak developing at 70kHz, this correlating with the damped overshoot seen in fig.3.
Fig.4 Halcro Logic MC20, frequency response at 2.83V into (from top to bottom at 2kHz): 32 ohms, 16 ohms, simulated loudspeaker load, 8, 4, 2 ohms (0.5dB/vertical div., right channel dashed).
Fig.4 also shows the variation of response with our standard simulated speaker load, which is moderate at ±0.2dB, implying an output impedance only a little higher than is usual for a solid-state design, despite the presence of the MC20's output filter. I measured a value of 0.3 ohm at midrange and bass frequencies, this rising slightly, to 0.55 ohm, at 20kHz. The amplifier's unbalanced input impedance was slightly but usefully more than specified, at 13k ohms through the low treble, but it did drop to 9875 ohms at 20kHz. The balanced figure was lower than specified, at 14k ohms. The MC20 inverted signal polarity from both sets of inputs.
Measuring channel separation was complicated by the presence of ultrasonic noise. However, using the external low-pass filter, I measured midband figures approaching 100dB, which is excellent. Similarly for signal/noise measurements, I had to use the low-pass filter, which gave an audioband figure of 91.7dB ref. 2.83V into 8 ohms. Without the filter, this degraded to 58dB, due to leakthrough of the noise.
Fig.5 Halcro Logic MC20, distortion (%)vs 1kHz continuous output power into (from bottom to top at 100W): 8, 4, 2 ohms.
For reasons already explained, I used the 30kHz active low-pass filter to measure how THD+N changed with frequency, which is why fig.6 is plotted only up to 10kHz, the highest frequency at which the third harmonic will be allowed through by this filter. At most frequencies, there is no difference in the THD+N percentage taken into loads ranging from 2 to 8 ohms. There is a peculiar change centered on 90Hz, however, where the THD+N increases into lower impedances. I have no idea what this means, but as the level of spuriae is still below 0.04%, I don't think it significant.
Fig.6 Halcro Logic MC20, THD+N (%)vs frequency at 4.7V into (from bottom to top at 100Hz): 8, 4, 2 ohms.
Without the low-pass filter, it was fruitless to look at the waveform of the spuriae to assess the dominant harmonic; all you can see is ultrasonic noise (fig.7). With the filter, the dominant harmonic, at least at midrange frequencies, is the subjectively benign third (fig.8). But at low frequencies, the increase in THD seen in fig.6 appears to be due to the appearance of the second harmonic (fig.9). Intermodulation distortion was also very low in level (fig.10), though the need to use the active low-pass filter for this measurement meant that I could not do this test at high output powers.
Fig.7 Halcro Logic MC20, 1kHz waveform at 6W into 8 ohms (top), 0.2% THD+N; distortion and noise waveform with fundamental notched out (bottom, not to scale).
Fig.8 Halcro Logic MC20, 1kHz waveform at 6W into 8 ohms (top), 0.0116% THD+N, with sixth-order low-pass filter at 30kHz; distortion and noise waveform with fundamental notched out (bottom, not to scale).
Fig.9 Halcro Logic MC20, spectrum of 50Hz sinewave, DC–1kHz, at 6W into 8 ohms, with sixth-order low-pass filter at 30kHz (linear frequency scale).
Fig.10 Halcro Logic MC20, HF intermodulation spectrum, DC–24kHz, 19+20kHz at 12W peak into 8 ohms (linear frequency scale).