
Sidebar 3: Measurements
I measured one of the DeVore Fidelity Gibbon Super Nines that had been auditioned by KM; it had the serial number S915B112. I used DRA Labs' MLSSA system and a calibrated DPA 4006 microphone with an Earthworks microphone preamplifier for the farfield frequency behavior and dispersion measurements. I used an Earthworks QTC-40 mike for the nearfield responses and Dayton Audio's DATS V2 system to measure the impedance magnitude and electrical phase angle.
The saddle centered at 33Hz in the magnitude trace in fig.1 indicates that this is the tuning frequency of the two ports at the base of the enclosure's rear wall. The red trace in fig.3 shows the nearfield response of the ports. It reaches its maximum level at the tuning frequency, but the upper-frequency rollout is marred by high-level resonant peaks at 176Hz, 348Hz, 645Hz, and 853Hz. The frequency of the mode at 176Hz is suspiciously the same as one of the resonant modes I found when I examined the enclosure's vibrational behavior. I could hear this mode as a "hooty" coloration when I listened directly to the output of the ports both with a slowly swept sinewave and with recorded male vocals. The higher-frequency modes in the ports' output added audible coloration to the sound of pink noise when I stood behind the Super Nine. The ports face away from the listener, which should reduce the audibility of the resonances at the listening position.
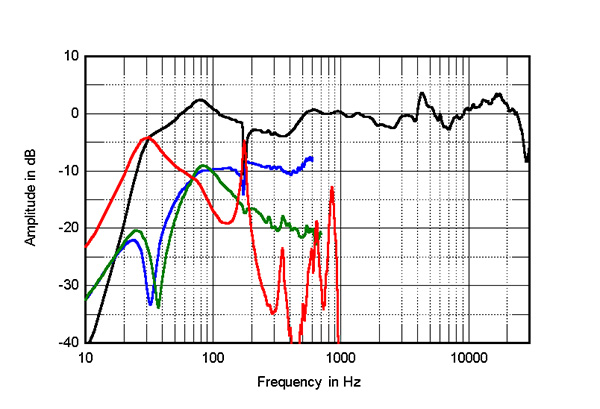
The black trace above 310Hz in fig.3 shows the Super Nine's quasi-anechoic farfield response, averaged across a 30° horizontal window centered on the tweeter axis. The response is generally smooth and even, though there is a slight lack of energy in the middle of the midrange and a peak between 4kHz and 6kHz.
In most respects, the DeVore Fidelity Gibbon Super Nine offers respectable measured performance, but I must admit that I was bothered by the presence of resonances in the ports' output and by the ridge of delayed energy in the presence region.
My experience of other speakers designed by John DeVore is that he carefully balances the overall presentation so that measured defects don't intrude (footnote 4). After I had finished measuring the Super Nine, I set it up in my listening room, driving this single speaker with a Parasound JCA100 Tribute amplifier. The upper bass did sound slightly exaggerated, but not enough to interfere with the speaker's reproduction of bass guitar and double bass. However, the forward-sounding presence region was relatively unforgiving of recordings that were themselves overcooked in this region, even when I was listening well to the side of the speaker.—John Atkinson
Footnote 1: As the Super Nine has a specified nominal impedance of 8 ohms, the values in both units—dB/W/1m and dB/2.83V/1m—are identical.
Footnote 2: EPDR is the resistive load that gives rise to the same peak dissipation in an amplifier's output devices as the loudspeaker. See "Audio Power Amplifiers for Loudspeaker Loads," JAES, Vol.42 No.9, September 1994, and stereophile.com/reference/707heavy/index.html.
Footnote 3: This means that the loudspeaker is firing into hemispherical space rather than a full sphere. A speaker that has a truly flat response in the usual "4pi" space will therefore appear to have a boosted upper-bass output with a nearfield measurement, the center frequency of that boost depending on the physical dimensions of the speaker and the woofer alignment. See stereophile.com/content/measuring-loudspeakers-part-three-page-6 or aes2.org/publications/elibrary-page/?id=7171.
Footnote 4: For example, read my concluding comments here.
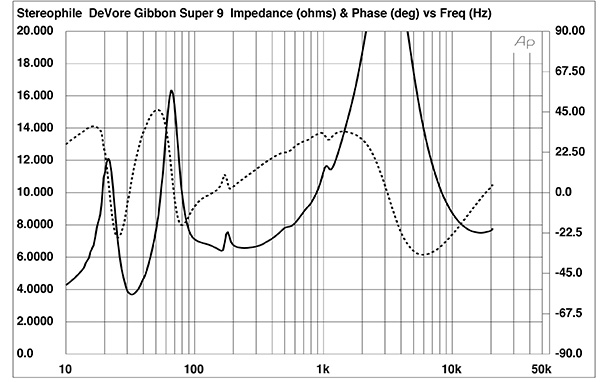
Fig.1 DeVore Fidelity Gibbon Super Nine, electrical impedance (solid) and phase (dashed) (2 ohms/vertical div.).
DeVore Fidelity specifies the Super Nine's anechoic sensitivity as 91dB/W/1m. While my B-weighted estimate was slightly lower than the specified figure, at 89dB(B)/2.83V/1m, this is still higher than average (footnote 1). The Super Nine's impedance is specified as 8 ohms, with a minimum value of 5.5 ohms. My measurement lies above 6 ohms for most of the audioband (fig.1, solid trace), with a minimum value of 3.7 ohms at 33Hz. The higher value at high frequencies than at low frequencies means that the treble will sound exaggerated if this speaker is used with amplifiers having a high output impedance. As the electrical phase angle (dashed trace) is sometimes high, the effective resistance, or EPDR (footnote 2), drops below 3 ohms between 26Hz and 53Hz, with a minimum value of 1.8 ohms at 40Hz. Although the EPDR remains above 3.7 ohms above 380Hz, the Super Nine is a demanding amplifier load at bass frequencies.
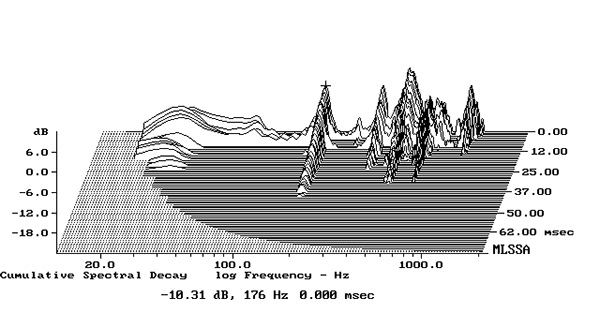
Fig.2 DeVore Fidelity Gibbon Super Nine, cumulative spectral-decay plot calculated from output of accelerometer fastened to center of the rear wall level with the upper woofer (MLS driving voltage to speaker, 7.55V; measurement bandwidth, 2kHz).
The discontinuities in the traces just below 200Hz and at 1020Hz in fig.1 imply resonances of various kinds in these regions. I investigated the enclosure's vibrational behavior with a plastic-tape accelerometer; the highest-level resonant modes I found lay at 176Hz, 355Hz, 492Hz, and just above 1kHz on the rear wall level with the upper woofer (fig.2). These modes were also present on the sidewalls at much lower levels. I could hear all the resonant modes with a stethoscope when I played a swept sinewave tone, but they are low in level, even on the rear wall, and have a high Q (Quality Factor). I doubt that they will have audible consequences.
Fig.3 DeVore Fidelity Gibbon Super Nine, anechoic response on tweeter axis at 50", averaged across 30° horizontal window and corrected for microphone response, with the nearfield responses of the upper woofer (blue, offset by –6dB), lower woofer (green, offset by –6dB), port (red), and the complex sum of the nearfield responses respectively plotted below 600Hz, 800Hz, 975Hz, and 310Hz.
The blue trace in fig.3 shows the nearfield response of the upper woofer, the green trace that of the lower woofer, both offset by –6dB for clarity. Both have minimum-motion notches close to the port tuning frequency, which is when the back pressure from the port resonance holds their diaphragms stationary. But note that the lower woofer's output slowly rolls off above 100Hz, and its level is 12dB lower than that of the upper woofer at 600Hz. This confirms that the Super Nine is what is called a "2.5-way" design, where only the upper woofer's response extends to the crossover frequency of the tweeter.
There is only a modest rise in the midbass of the complex sum of the woofer and port responses (black trace below 310Hz in fig.3) due to the nearfield measurement technique, which assumes that the drive units are mounted in a true infinite baffle (footnote 3). The Super Nine's woofer alignment is thus slightly overdamped. The low frequencies start to roll off at 60Hz, reaching –6dB at the port tuning frequency of 33Hz.
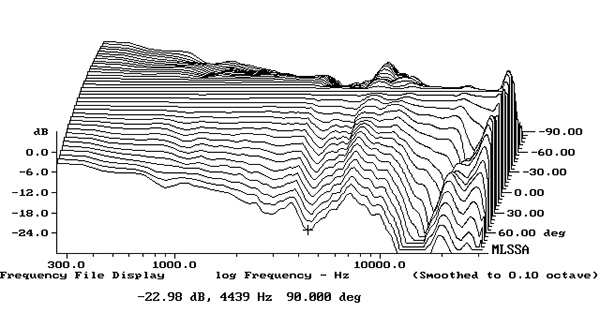
Fig.4 DeVore Fidelity Gibbon Super Nine, lateral response family at 50", normalized to response on tweeter axis, from back to front: differences in response 90–5° off axis on port side of baffle, reference response, differences in response 5–90° off axis on tweeter side of baffle.
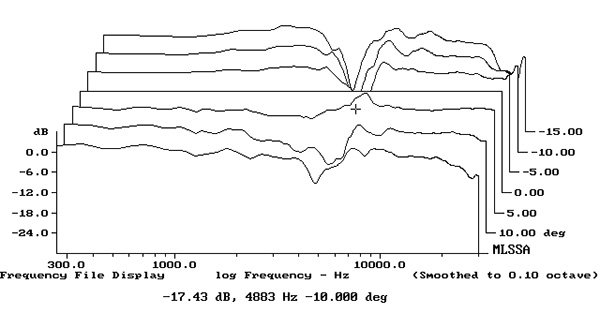
Fig.5 DeVore Fidelity Gibbon Super Nine, vertical response family at 50", normalized to response on tweeter axis, from back to front: differences in response 15–5° above axis, reference response, differences in response 5–15° below axis.
Fig.4 shows the Super Nine's horizontal dispersion, normalized to the response on the tweeter axis, which thus appears as a straight line. The radiation pattern is generally even, which correlates with accurate and stable stereo imaging. Comparing this graph with the black trace in fig.3, it looks as if the peak in the mid-treble and the small suckout just above it both flatten at off-axis angles. This suggests that the Super Nine's treble will sound at its most even if the speakers are not toed in to the listening position, though the fact that the dispersion narrows above 10kHz will reduce top-octave "air"; these two factors will need to be balanced in positioning the Super Nines. The DeVore speaker's radiation pattern in the vertical plane, again normalized to the response on the tweeter axis, which is 36" from the floor with the speaker supported on its spikes, is shown in fig.5. A large suckout centered on 4.88kHz appears in the loudspeaker's output more than 5° above the tweeter axis, which implies that this is the crossover frequency between the upper woofer and the tweeter. There is more mid-treble energy 5° below the measurement axis. Like many speakers, the Super Nines are best experienced while seated.
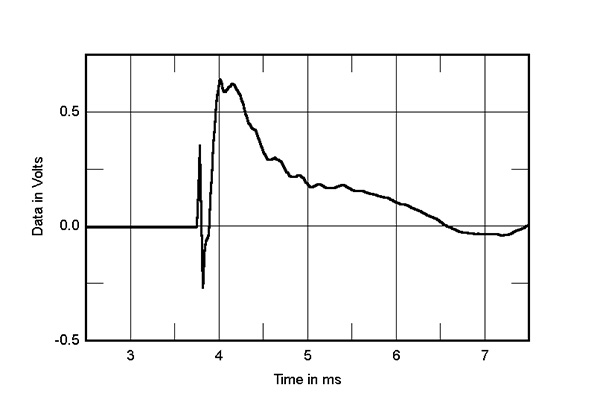
Fig.6 DeVore Fidelity Gibbon Super Nine, step response on tweeter axis at 50" (5ms time window, 30kHz bandwidth).
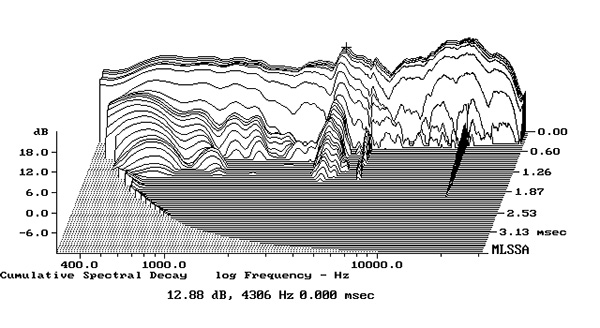
Fig.7 DeVore Fidelity Gibbon Super Nine, cumulative spectral-decay plot on tweeter axis at 50" (0.15ms risetime).
In the time domain, the Super Nine's step response (fig.6) indicates that all three drive units are connected in positive acoustic polarity. The tweeter's output arrives first at the microphone, followed by that of the woofers. The decay of the tweeter's step blends relatively smoothly with the start of the woofers' step, which implies an optimal crossover implementation; this blend appears best just below the tweeter axis. The Super Nine's cumulative spectral-decay plot (fig.7) is extremely clean in the midrange, the low treble, and the top two audioband octaves. (As always with my waterfall plots, ignore the ridge of delayed energy close to 16kHz, which is due to interference from the MLSSA host PC's video circuitry.) However, the peak in the presence region in the on-axis response is associated with a narrow ridge of delayed energy.
Footnote 1: As the Super Nine has a specified nominal impedance of 8 ohms, the values in both units—dB/W/1m and dB/2.83V/1m—are identical.