Sidebar 3: Measurements
I measured the dCS Vivaldi Apex with my Audio Precision SYS2722 system, repeating some measurements with the higher-performance APx500. I performed the testing with the AES3 and USB inputs. The Vivaldi's AES3 input accepted data sampled at all rates up to 192kHz, and the dual-AES3 input will accept data sampled at rates up 384kHz. With the Vivaldi Apex set to USB Class 1, Apple's AudioMIDI utility indicated that the maximum sample rate for USB data was 96kHz. With it set to Class 2, the dCS processor accepted 16- and 24-bit integer data via USB sampled at all rates from 44.1kHz to 384kHz. Apple's USB Prober app identified the Vivaldi Apex as "dCS Vivaldi DAC USB Class 2" from "Data Conversion Systems Ltd" and confirmed that the USB port operates in the optimal isochronous asynchronous mode.
For the measurements, the dCS Vivaldi Apex's output level was set to 6V, the volume control set to its maximum, and the mapping algorithm set to Map 3, which was how it had been set when I unpacked the processor. With the Phase set to positive, the Vivaldi's analog outputs preserved absolute polarity (ie, were noninverting) from both digital inputs. The maximum output can be set to "6V," "2V," "0.6V," and "0.2V." With full-scale 1kHz data and the volume control set to its maximum, I measured 6.03V, 2.04V, 603mV, and 204mV from the balanced outputs and very slightly lower voltages from the single-ended outputs. The balanced output impedance was an extremely low 1.3 ohms from 20Hz to 20kHz. The single-ended output impedance was 51 ohms at all audio frequencies.
Footnote 1: For a good if not great result with this test, see fig.5 in my Rotel DT-6000 FollowUp elsewhere in this issue.
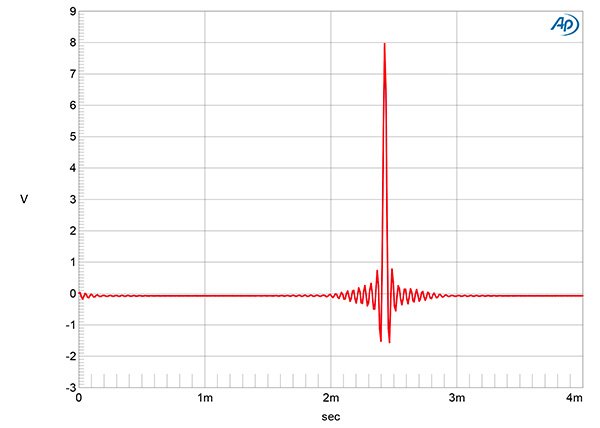
Fig.1 dCS Vivaldi Apex, F1, impulse response (one sample at 0dBFS, 44.1kHz sampling, 4ms time window).
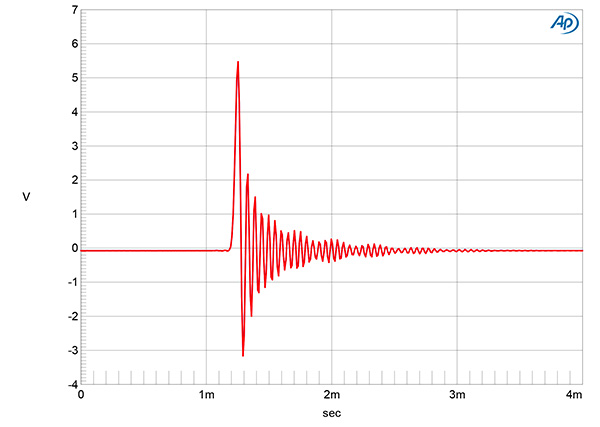
Fig.2 dCS Vivaldi Apex, F5, impulse response (one sample at 0dBFS, 44.1kHz sampling, 4ms time window).
The Vivaldi Apex offers a choice of six reconstruction filters. All six filters are functional with data having a sample rate of 44.1, 48, 176.4, and 192kHz, but, as with the Rossini Apex JVS reviewed in October 2022 and the original Vivaldi Michael Fremer reviewed in January 2014, only the first four (F1–F4) operate with data sampled at 88.2 and 96kHz. Fig.1 shows the F1 filter's impulse response with 44.1kHz data; the F6 filter's impulse response was identical. It is typical of a linear-phase reconstruction filter, with equal amounts of ringing before and after the single sample at 0dBFS. Filters F2, F3, and F4 also had linear-phase impulse responses but with progressively smaller amounts of ringing. F5 was different. Its impulse response was a minimum-phase type, with all the ringing following the single full-scale sample (fig.2).
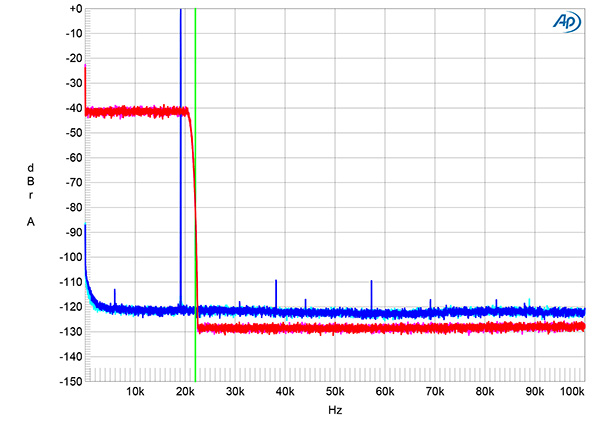
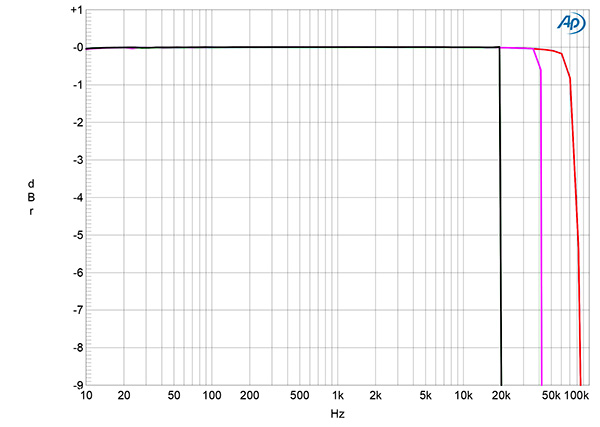
Fig.3 dCS Vivaldi Apex, F1, wideband spectrum of white noise at –4dBFS (left channel red, right magenta) and 19.1kHz tone at 0dBFS (left blue, right cyan) into 100k ohms with data sampled at 44.1kHz (20dB/vertical div.).
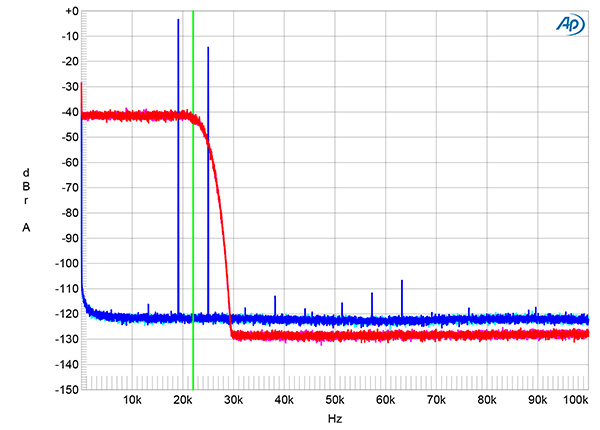
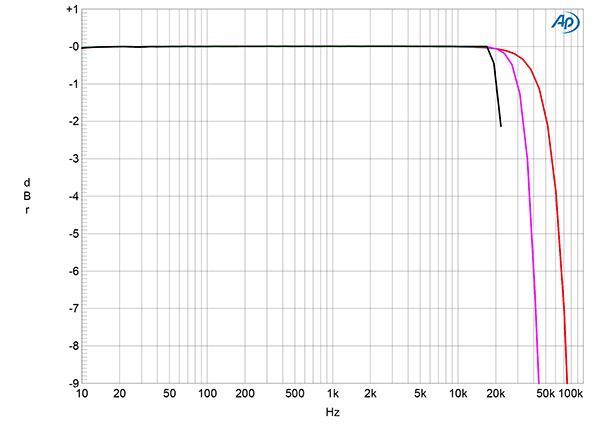
Fig.4 dCS Vivaldi Apex, F4, wideband spectrum of white noise at –4dBFS (left channel red, right magenta) and 19.1kHz tone at –3dBFS (left blue, right cyan) into 100k ohms with data sampled at 44.1kHz (20dB/vertical div.).
With 44.1kHz white-noise data, F1, F5, and F6 are apodizing types, rolling off rapidly above the audioband (fig.3, magenta and red traces) and reaching full stop-band attenuation at 22.05kHz. F2, F3, and F4 offered progressively slower ultrasonic rolloffs with 44.1kHz data, with F4 not reaching full stop-band attenuation until 30kHz (fig.4). With a 19.1kHz tone at –3dBFS (cyan, blue; with the tone at 0dBFS, many aliasing products were present in the audioband with this filter), the slow rolloff means that the aliased image at 25kHz was only suppressed by 12dB. The harmonics associated with the 19.1kHz tone were all extremely low in level, however.
Fig.5 dCS Vivaldi Apex, F1, frequency response at –12dBFS into 100k ohms with data sampled at: 44.1kHz (left channel green, right gray) and 192kHz (left blue, right red) (1dB/vertical div.).
Fig.6 dCS Vivaldi Apex, F4, frequency response at –12dBFS into 100k ohms with data sampled at: 44.1kHz (left channel green, right gray) and 192kHz (left blue, right red) (1dB/vertical div.).
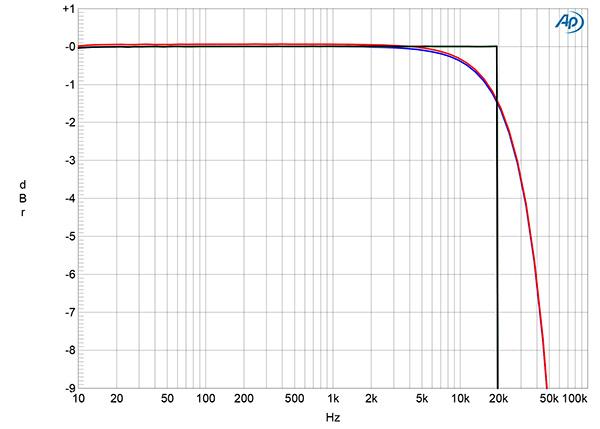
Fig.7 dCS Vivaldi Apex, F5, frequency response at –12dBFS into 100k ohms with data sampled at: 44.1kHz (left channel green, right gray) and 192kHz (left blue, right red) (1dB/vertical div.).
The F1 filter's frequency response with data sampled at 44.1, 96, and 192kHz (fig.5) was flat to just below half of each sample rate, with then a fast rolloff. The rolloffs were slower and started progressively earlier with F2, F3, and F4 (fig.6). F5 gave a sharp rolloff with 44.1kHz data (fig.7, green and gray traces) but a slower rolloff with 192kHz data (blue, red), reaching –6dB at 40kHz.
Fig.8 dCS Vivaldi Apex, balanced output, spectrum with noise and spuriae of dithered 1kHz tone at 0dBFS with 24-bit data (left blue, right red) (20dB/vertical div.).
Channel separation (not shown) was superb, at >125dB in both directions below 3kHz, decreasing to a still excellent 113dB at the top of the audioband. The low-frequency noisefloor (fig.8) was free of power supply–related spuriae, and random noise was very low in level.
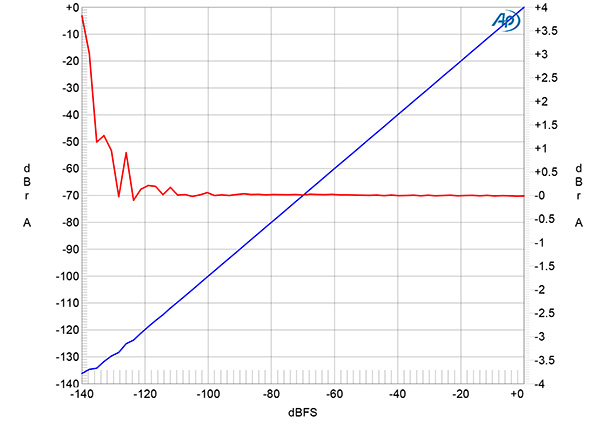
Fig.9 dCS Vivaldi Apex, Map 3, left channel, 1kHz output level vs 24-bit data level in dBFS (blue, 20dB/vertical div.); linearity error (red, 1dB/small vertical div.).
The red trace in fig.9 plots the error in the analog output level with Map 3 as a 24-bit, 1kHz digital tone stepped down from 0dBFS to –140dBFS. The amplitude error is negligible until the signal lies below –135dBFS, which implies very high resolution (footnote 1). Repeating this test with Maps 1 and 2 gave identical results.
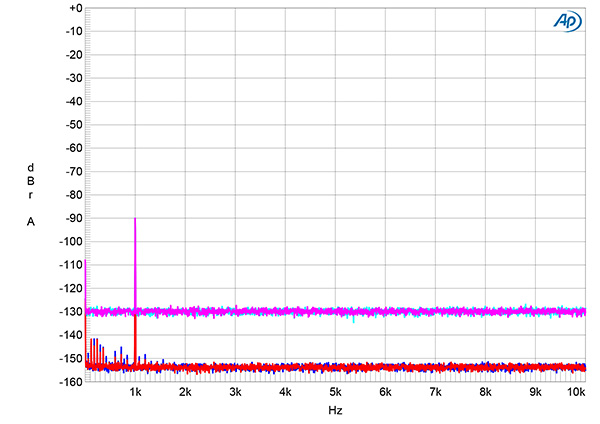
Fig.10 dCS Vivaldi Apex, spectrum with noise and spuriae of dithered 1kHz tone at –90dBFS with: 16-bit data (left channel cyan, right magenta), 24-bit data (left blue, right red) (20dB/vertical div.).
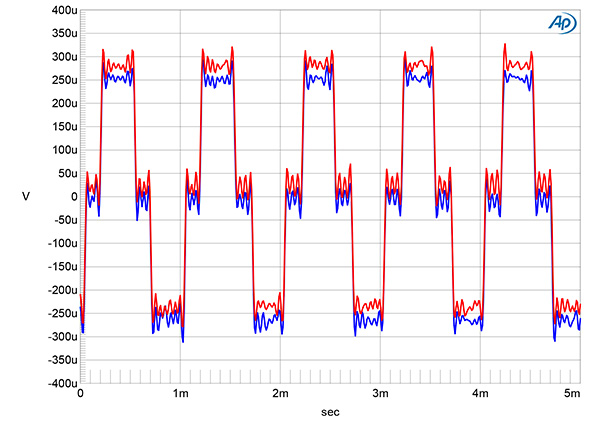
Fig.11 dCS Vivaldi Apex, waveform of undithered 16-bit, 1kHz sinewave at –90.31dBFS (left channel blue, right red).
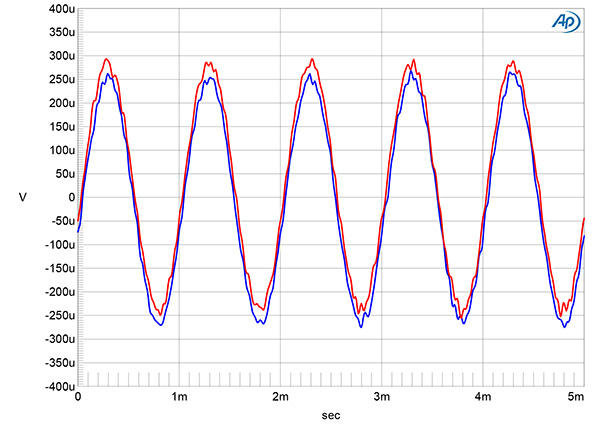
Fig.12 dCS Vivaldi Apex, waveform of undithered 24-bit, 1kHz sinewave at –90.31dBFS (left channel blue, right red).
An increase from 16 bits to 24 bits with dithered data representing a 1kHz tone at –90dBFS (fig.10) dropped the dCS Vivaldi Apex's noise floor by 25dB, which implies a very high resolution: at least 20 bits. When I played undithered data representing a tone at exactly –90.31dBFS, the waveform was symmetrical, the three DC voltage levels described by the data cleanly resolved (fig.11). Repeating the measurement with undithered 24-bit data gave a well-formed sinewave (fig.12).
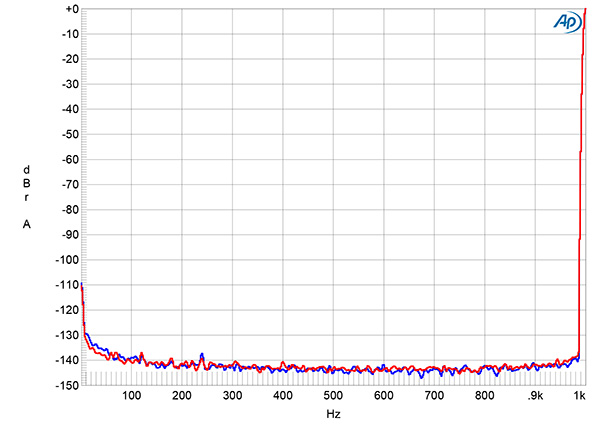
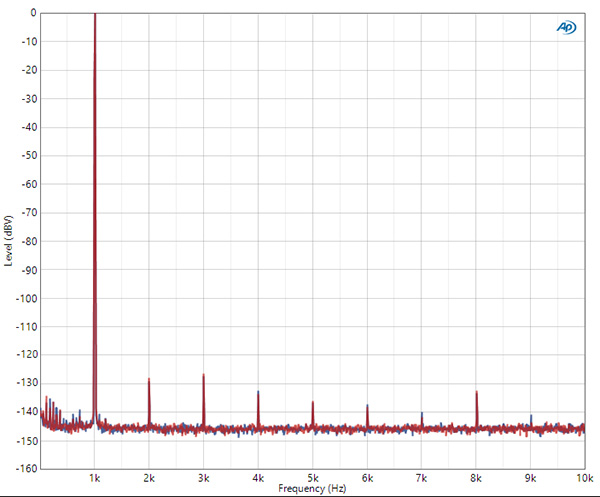
Fig.13 dCS Vivaldi Apex, balanced output, 24-bit data, spectrum of 1kHz sinewave, 10Hz–10kHz, at 0dBFS into 600 ohms (left channel blue, right red; linear frequency scale).
The dCS Vivaldi Apex produced such low levels of harmonic distortion that I needed to use the higher-resolution APx500 analyzer to examine its behavior. With a full-scale 1kHz tone and the Vivaldi set to output its highest level of 6V, the THD+noise measured just 0.00026%! The third harmonic was the highest in level at a vanishingly low –127dB (0.00005%), even into the punishing 600 ohm load (fig.13).
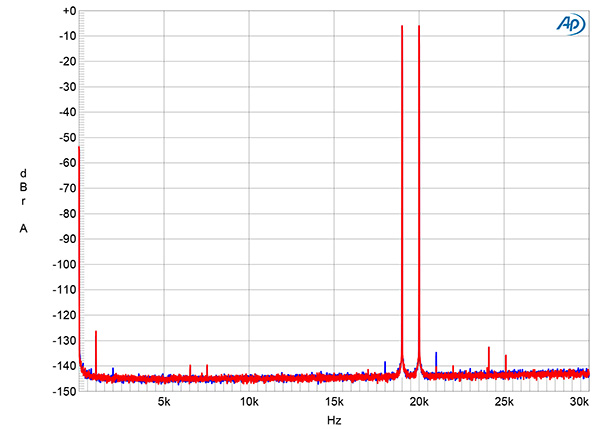
Fig.14 dCS Vivaldi Apex, balanced output, F1, 24-bit data, HF intermodulation spectrum, DC–30kHz, 19+20kHz at –3dBFS into 100k ohms, 44.1kHz data (left channel blue, right red; linear frequency scale).
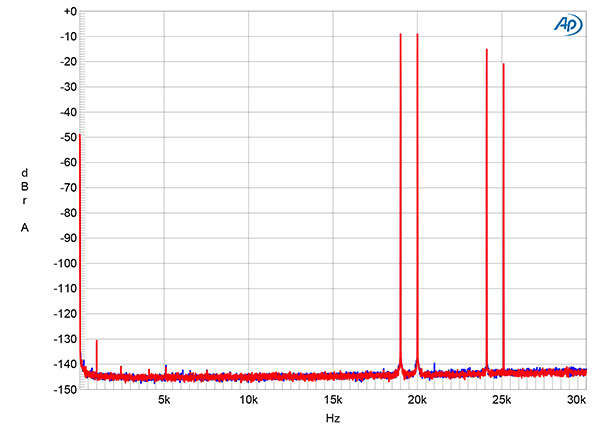
Fig.15 dCS Vivaldi Apex, balanced output, F4, 24-bit data, HF intermodulation spectrum, DC–30kHz, 19+20kHz at –3dBFS into 100k ohms, 44.1kHz data (left channel blue, right red; linear frequency scale).
The level of intermodulation distortion with an equal mix of 19 and 20kHz tones with a peak level of –3dBFS was also vanishingly low (fig.14). Aliased images of the primary tones appeared above the audioband with the slowest-rolloff F4 filter (fig.15), but the only intermodulation product visible in this graph, the second-order difference product at 1kHz, lay at –130dB (0.00003%).
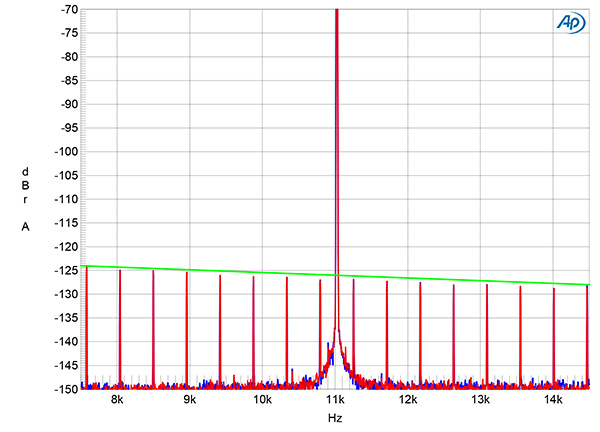
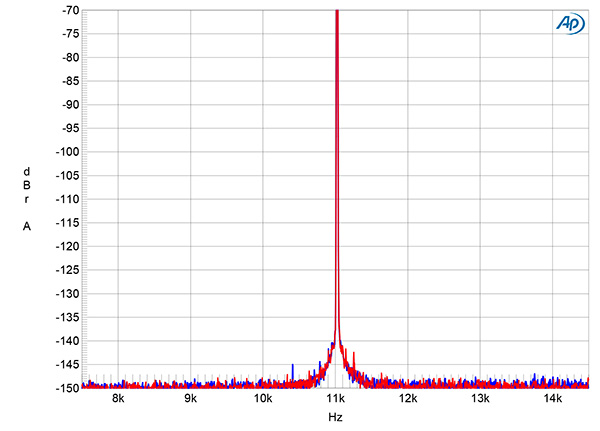
Fig.16 dCS Vivaldi Apex, high-resolution jitter spectrum of analog output signal, 11.025kHz at –6dBFS, sampled at 44.1kHz with LSB toggled at 229.6875Hz: 16-bit AES3 data (left channel blue, right red). Center frequency of trace, 11.025kHz; frequency range, ±3.5kHz.
Fig.17 dCS Vivaldi Apex, high-resolution jitter spectrum of analog output signal, 11.025kHz at –6dBFS, sampled at 44.1kHz with LSB toggled at 229.6875Hz: 24-bit AES3 data (left channel blue, right red). Center frequency of trace, 11.025kHz; frequency range, ±3.5kHz.
Fig.16 shows the spectrum of the Vivaldi Apex's output when it was fed high-level, undithered, 16-bit J-Test data via AES3. The odd-order harmonics of the undithered low-frequency, LSB-level squarewave lie at the correct levels, indicated by the sloping green line, and the noisefloor between the sidebands is extremely low. Repeating the test with 24-bit J-Test data with both AES3 and USB data (fig.17) gave a similarly accurate result.
Like its Vivaldi predecessor and the Rossini Apex, the dCS Vivaldi Apex features superb measured performance.—John Atkinson
Footnote 1: For a good if not great result with this test, see fig.5 in my Rotel DT-6000 FollowUp elsewhere in this issue.


