Sidebar 3: Measurements
It was difficult to decide which tests would be best at uncovering what the Chord Hugo M Scaler was doing. If I examined, with my Audio Precision SYS2722 system (see the January 2008 "As We See It"), the analog output of Chord's DAVE or another D/A processor when fed upsampled data from the M Scaler, the result would be obscured by the anti-aliasing filter of the AP's A/D converter. I could examine the digital output of the M Scaler, but the analyzer's S/PDIF input is restricted to sample rates of 192kHz and below. Despite these cautions, I feel the following measurements do characterize the M Scaler's behavior.
For the testing, I fed data sampled at 44.1kHz or 48kHz to one of the M Scaler's optical inputs from either the Audio Precision's optical S/PDIF output or from that of a Pioneer SACD player used as a transport. I also fed the Chord USB data sourced from my MacBook Pro running on battery power with Pure Music 3.0 playing WAV and AIFF test-tone files. Apple's USB Prober utility identified the Chord as "Hugo M SCALER" from "Chord Electronics Ltd" with the serial number "413-001." The M Scaler's USB port operated in the optimal isochronous asynchronous mode. Apple's Audio-MIDI utility revealed that, via USB, the M Scaler accepted 32-bit integer data sampled at all rates from 32 to 768kHz.
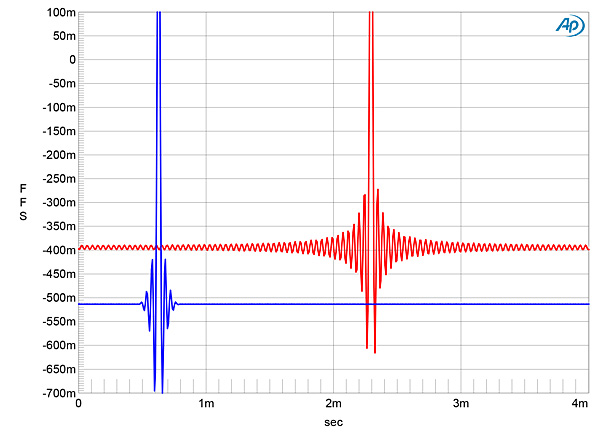
In the M Scaler's pass-through mode, setting the output sample rate to be the same as the input rate reduces the signal level and adds dither at the LSB level. The blue trace in fig.1 shows the Scaler's impulse response, captured in the digital domain (no conversion to analog) when fed a 48kHz impulse and set to output 48kHz data. The vertical scale in this graph is exaggerated to reveal fine detail—the impulse is typical of a short linear-phase filter, with just three samples of pre- and post-ringing. By contrast, the red trace in fig.1 shows the effect of upsampling the 48kHz impulse to 192kHz, again captured in the digital domain. The filter is still a time-symmetrical linear-phase type, but now a very large amount of pre- and post-ringing is present.
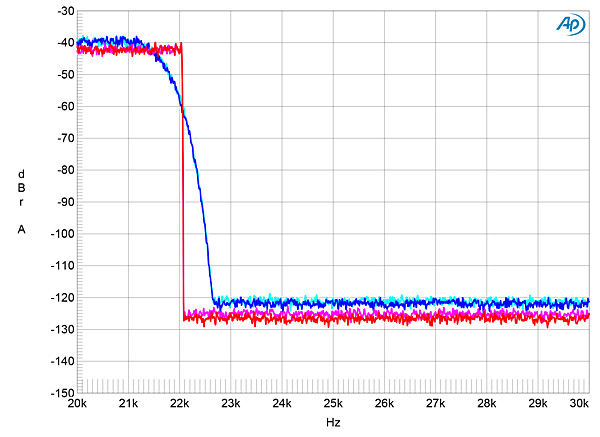 The red trace shows the spectrum of the No.30.6's analog output when fed the same data upsampled to 88.2kHz by the M Scaler. The output is now flat to 22kHz, and the Chord's upsampling filter drops like a stone above that frequency, reaching full attenuation at exactly half the original sampling frequency, 22.05kHz. The 2.8dB reduction in level imposed by the M Scaler DSP can be seen below 21kHz in this graph. However, for reasons I can't figure, the reduction in the upsampled ultrasonic stop-band noise is twice as large.
I repeated these spectral analyses with other signals, including single- and multitone signals (fig.3). The only sign of mild misbehavior was with a full-scale, 24-bit 20kHz tone, sampled at 48kHz and upsampled to 192kHz with the M Scaler (fig.4). Analyzed in the digital domain—no D/A conversion—aliased images can be seen at 28kHz (48–20), 68kHz (48+20), and 76kHz (96–20). However, as these all lie at or below –140dBFS (0.00001%), effectively they won't exist in real-world D/A conversion!—John Atkinson
The red trace shows the spectrum of the No.30.6's analog output when fed the same data upsampled to 88.2kHz by the M Scaler. The output is now flat to 22kHz, and the Chord's upsampling filter drops like a stone above that frequency, reaching full attenuation at exactly half the original sampling frequency, 22.05kHz. The 2.8dB reduction in level imposed by the M Scaler DSP can be seen below 21kHz in this graph. However, for reasons I can't figure, the reduction in the upsampled ultrasonic stop-band noise is twice as large.
I repeated these spectral analyses with other signals, including single- and multitone signals (fig.3). The only sign of mild misbehavior was with a full-scale, 24-bit 20kHz tone, sampled at 48kHz and upsampled to 192kHz with the M Scaler (fig.4). Analyzed in the digital domain—no D/A conversion—aliased images can be seen at 28kHz (48–20), 68kHz (48+20), and 76kHz (96–20). However, as these all lie at or below –140dBFS (0.00001%), effectively they won't exist in real-world D/A conversion!—John Atkinson
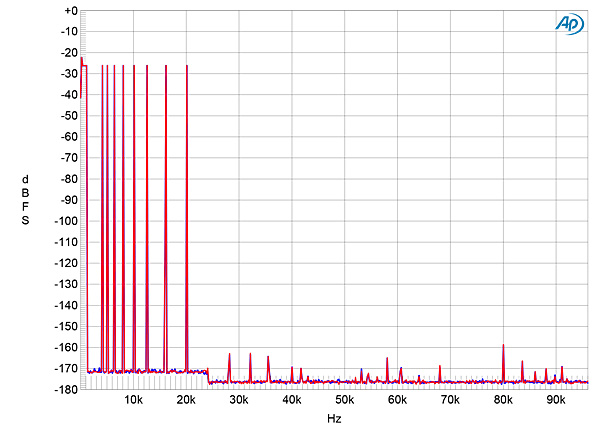
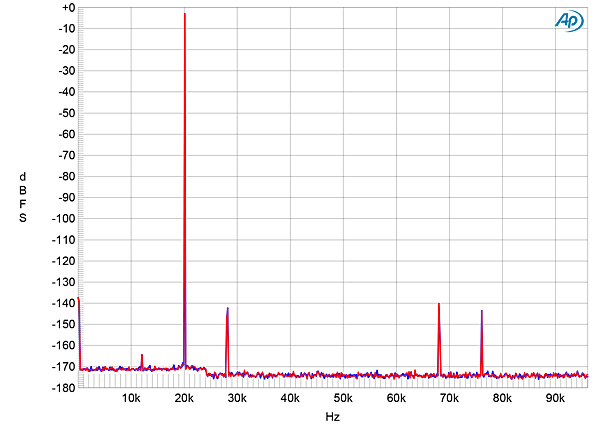
Fig.1 Chord M Scaler, digital-domain impulse response sampled at 48kHz, resampled to 48kHz (blue) and upsampled to 192kHz (red) (4ms time window, exaggerated vertical scale).
To look at the effect of the M Scaler's upsampling filter in the frequency domain, I wanted to use a conventional D/A processor. I dug out the sample of the Mark Levinson No.30.6 that I purchased after reviewing it back in 1999. I first fed it 16-bit white noise sampled at 44.1kHz. The blue and cyan traces in fig.2 show the effect of the Levinson's reconstruction filter with this signal, plotted between 20kHz and 30kHz and with the processor's analog output signal captured by Audio Precision's A/D converter running at a 100kHz sample rate. The output starts to roll off above 21kHz and reaches full stop-band attenuation at 22.7kHz.
Fig.2 Mark Levinson No.30.6, spectrum, 20kHz–30kHz, of 16-bit white noise sampled at 44.1kHz at –4dBFS (left channel blue, right cyan) and upsampled to 88.2kHz with M Scaler (left channel red, right magenta) (20dB/vertical div.).
Fig.3 Chord M Scaler, wideband digital-domain spectrum, 16-bit multitone signal at 0dBFS sampled at 44.1kHz and upsampled to 176.4kHz (20dB/vertical div.).
Fig.4 Chord M Scaler, wideband digital-domain spectrum, 24-bit 20kHz tone at 0dBFS sampled at 48kHz and upsampled to 192kHz (20dB/vertical div.).


