I measure loudspeakers in our living room. I move the furniture to the sides, place the speaker on my computer-controlled Outline turntable, raising it so that the tweeter is midway between the floor and ceiling, and fire the speaker along one of the room's diagonals. That maximizes the anechoic time window before reflections from the room boundaries arrive at the microphone. However, I was unable to lift the heavy Canton Reference 5 as high off the ground as I would have wished. I therefore measured the response and dispersion with the microphone at 1m rather than my usual 50".
I used DRA Labs' MLSSA system and a calibrated DPA 4006 microphone to measure the farfield behavior of one of the Canton Reference 5 speakers and an Earthworks QTC-40 mike for the nearfield responses. I measured the Reference 5's impedance magnitude and electrical phase angle with Dayton Audio's DATS V2 system.
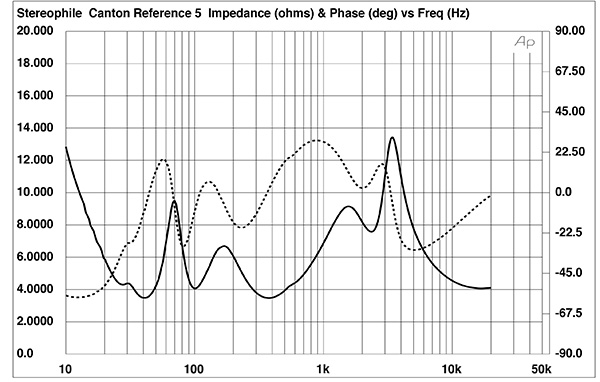
My B-weighted estimate of the Reference 5's voltage sensitivity was a high 89.4dB(B)/2.83V/1m. Fig.1 shows the impedance magnitude (solid trace) and electrical phase angle (dashed trace) with the high-frequency and midrange plugs on the rear panel set to the central Flat positions. The magnitude stays between 4 ohms and 8 ohms over most of the audioband, with minimum values of 3.48 ohms at 42Hz and 3.47 ohms at 372Hz. However, as the electrical phase angle is often high, the effective resistance, or EPDR (footnote 1), drops below 2 ohms below 39Hz and below 3 ohms for several regions between 46Hz and 1kHz, and above 5.2kHz. The minimum EPDR values are 1.56 ohms at 24Hz, 2.69 ohms at 51Hz, 2.17 ohms at 90Hz, and 2.17 ohms between 512Hz and 663Hz. As music can have high energy in the higher-frequency regions, the Reference 5 is a demanding amplifier load, though this will be ameliorated by its high sensitivity.
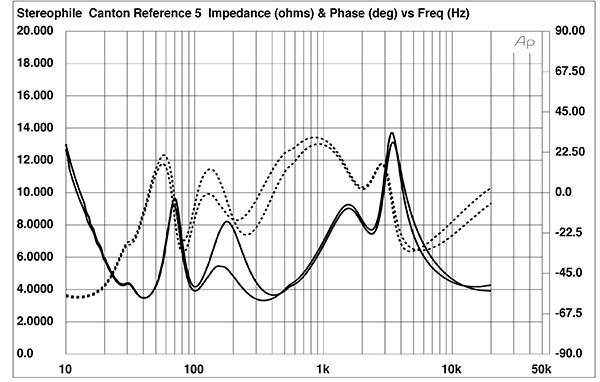
Repeating the impedance measurements with the high-frequency and midrange plugs set to the + and – positions gave, respectively, impedances of 5.45 ohms at 152Hz and 8.2 ohms at 180Hz (fig.2). The shape of the traces were otherwise very similar to the values with the plugs set to neutral.
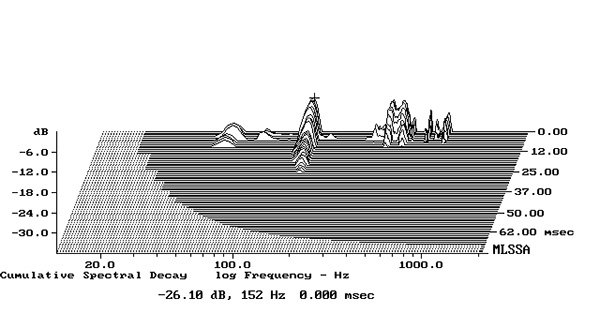
The Canton's enclosure seemed inert when I rapped its panels with my knuckles. When I investigated the Canton's vibrational behavior with a plastic-tape accelerometer, the highest-level resonant mode I found lay at 152Hz on the sidewalls level with the lower woofer, with two other modes at 402Hz and 465Hz (fig.3). However, these modes are all very low in level and have a high Q (Quality Factor), which means they won't have audible consequences.
The impedance magnitude trace in fig.1 has an unusual rise in value below 25Hz, which suggests that the crossover includes a high-pass filter in the woofer feed to reduce the diaphragms' excursion at infrasonic frequencies. This is confirmed by the nearfield responses of the woofers (blue trace) and the downward-firing port (red trace) in fig.4, which roll off with close to an 18dB/octave high-pass slope, a third-order slope instead of a reflex alignment's second order, 12dB/octave slope.
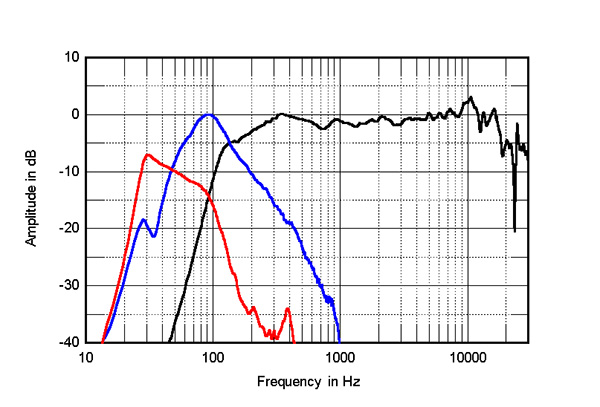
The saddle centered at 34Hz in the fig.1 magnitude trace indicates that this is the tuning frequency of the port. Its output peaks just below the tuning frequency, and the upper-frequency rollout is very clean. The two woofers behaved identically, and their summed nearfield response has the expected minimum-motion notch at the port tuning frequency. The woofers cross over to the midrange unit (fig.4, black trace below 350Hz) around 140Hz.
The complex sum of the woofer and port responses (black trace below 300Hz in fig.5) has only a modest rise in the midbass response that will be due to the nearfield measurement technique, which assumes that the drive units are mounted in a true infinite baffle (footnote 2). The Reference 5's woofer alignment is slightly overdamped, with the nearfield output down by 6dB at 40Hz.
The Reference 5's manual makes no mention of what vertical listening axis is optimal. Canton's Frank Goebl explained, "Our optimizations are based on an ear height of 110cm [43"] at a listening distance of 3 meters [10']. This applies to all our floorstanding models, regardless of the positioning of the tweeter or midrange driver. For this optimization, the acoustic radiation origin is evenly weighted between the tweeter and midrange driver, meaning the effective radiation point is positioned between them. Particular attention is given to the transition between the midrange driver and tweeter."
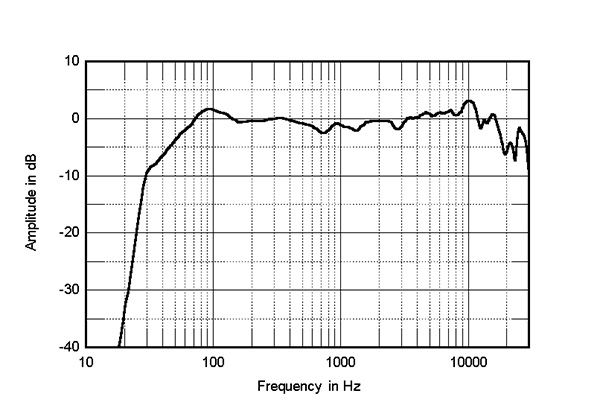
The midway point between the Reference 5's tweeter and midrange unit is 33" (84cm) from the floor, which is 3" lower than what a survey performed by Stereophile in the 1990s indicated was a typical listener ear height. But for a listener 10' away whose ears are 43" from the floor, this means that the optimal axis is tilted up from that midpoint by an angle of 5.5°. I therefore examined the farfield response on this optimal axis. The speaker's output at 1m on this axis (black trace above 350Hz) is generally even, tilting up slightly above 5kHz with a small peak centered on 10kHz. The graph supplied by Canton with the sample that I measured, serial number 24226938C, looked broadly similar to that shown in fig.4.
The black trace above 300Hz in fig.5 shows the Reference 5's quasi-anechoic farfield response averaged across a 30° horizontal window centered on the optimal axis. The response is even, with an upward tilt in the treble similar to that in fig.4. Repeating this measurement with the tweeter and midrange unit plugs set to the + and – positions respectively boosted and reduced the levels above 3kHz and between 200Hz and 1kHz by up to 1dB instead of the 1.5dB mentioned in the manual.
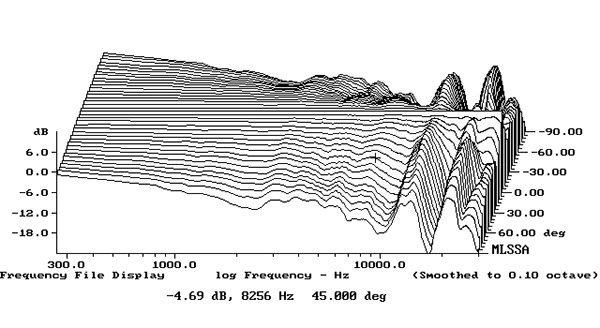
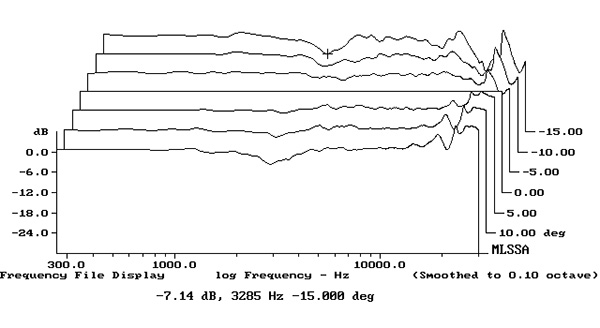
Fig.6 shows the Reference 5's horizontal dispersion, normalized to the response on the optimal axis, which thus appears as a straight line. The contour lines in this graph are even and well-controlled, which is known to correlate with stable stereo imaging. The small suckouts between 11kHz and 21kHz in the on-axis response fill in to the speaker's sides. The Canton's radiation pattern in the vertical plane, again normalized to the optimal-axis response (fig.7), indicates that the loudspeaker's response doesn't change appreciably up to 5° above and below that axis.
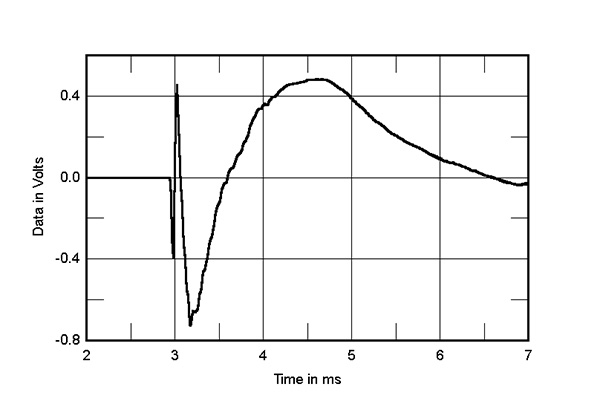
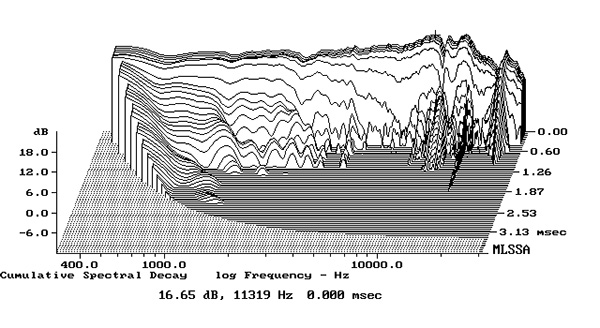
The Reference 5's step response on the optimal axis (fig.8) indicates that the tweeter and midrange driver are both connected in inverted acoustic polarity, the woofers in positive polarity. The tweeter's output arrives first at the microphone, followed by that of the midrange unit, then that of the woofer. The decay of each drive unit's step smoothly blends with the start of that of the next lower in frequency, which implies an optimal crossover topology. Other than some low-level delayed energy at the top of the audioband, the Canton's cumulative spectral-decay plot (fig.9) features a clean decay.
Overall, the Canton Reference 5 offers excellent measured performance.—John Atkinson
Footnote 1: EPDR is the resistive load that gives rise to the same peak dissipation in an amplifier's output devices as the loudspeaker. See "Audio Power Amplifiers for Loudspeaker Loads," JAES, Vol.42 No.9, September 1994, and stereophile.com/reference/707heavy/index.html.
Footnote 2: This means that the loudspeaker is firing into hemispherical space rather than a full sphere. A speaker that has a truly flat response in the usual "4pi" space will therefore appear to have a boosted upper-bass output with a nearfield measurement, the center frequency of that boost depending on the physical dimensions of the speaker and the woofer alignment. See this discussion.


